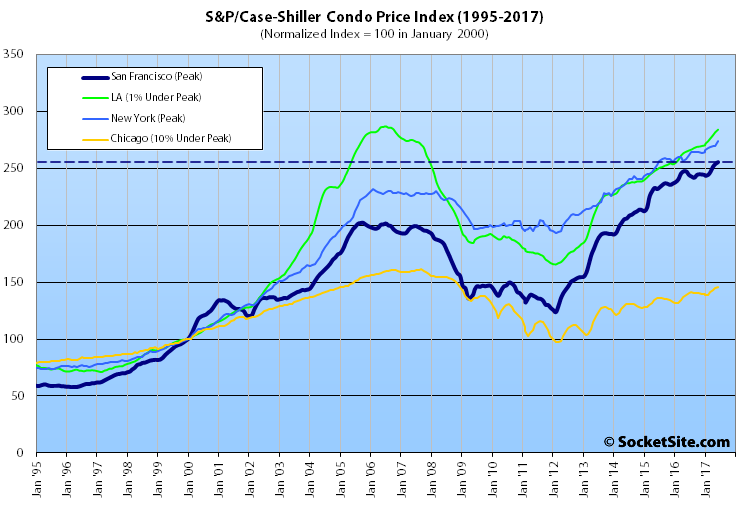
Having gained an upwardly revised 1.0 percent in May, the S&P CoreLogic Case-Shiller Index for single-family home values within the San Francisco Metropolitan Area – which includes the East Bay, North Bay and Peninsula – inched up 0.7 percent in June while the index for Bay Area condos inched up 0.6 percent, lifting each index to all-time highs.
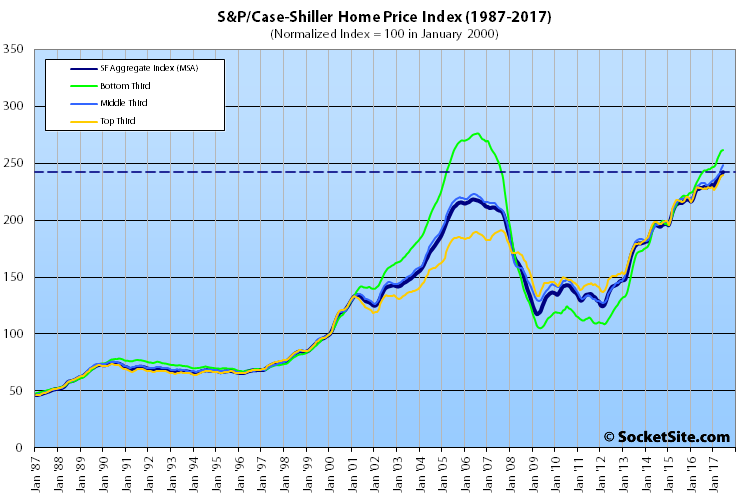
And with June’s gain, the index for single-family home values is now running 6.1 percent higher versus the same time last year, driven by outsized gains at the lower end of the market.
While the index for the top third of the market inched up 0.3 percent in June and is now 4.8 higher versus the same time last year, the index for the middle third of the market is 6.7 percent higher on a year-over-year basis having ticked up 1.3 percent in June and the index for the bottom third of the market is running 9.2 percent higher versus the same time last year having gained 0.3 percent in June as well.
At the same time, while the index for the top third of the market is now 25.1 percent above its previous peak ten years ago, and the middle third is now 11.3 percent higher, the index for the bottom third of the market has another 5.3 percent to gain before its back to its 2006-era peak.
With its 0.6 percent gain in June, the index for Bay Area condos is 4.6 percent higher versus the same time last year and 26.3 percent above its previous cycle peak in October 2005.
And for context, across the 20 major cities tracked by the home price index, Seattle, Portland and Dallas recorded the highest year-over-year gains in June, up 13.4 percent, 8.2 percent and 7.7 percent respectively versus a national average of 5.8 percent and a new all time high as well.
Our standard SocketSite S&P/Case-Shiller footnote: The S&P/Case-Shiller home price indices include San Francisco, San Mateo, Marin, Contra Costa and Alameda in the “San Francisco” index (i.e., greater MSA) and are imperfect in factoring out changes in property values due to improvements versus appreciation (although they try their best).
I assume this finally kills the narrative that “the market is falling” or “the downturn is upon us” or “down 20%!” Even prices of condos, the weakest segment, are at a new high.
Might the market turn south in the future, even the near future? Of course. Has it done so already? Clearly not. Buyers looking for bargains aren’t going to find any right now. Inventory is light; demand remains strong.
And yet there are plenty of properties in San Francisco proper that still aren’t fetching 2015 prices, and rents are down, while the broader Bay Area index continues to inch up.
This makes sense to me. Prices in San Francisco have raced higher faster, the underlying demand is still there, still strong, but the prices in SF have reached levels that only a smaller portion of the population can afford, so there is some stabilization.
Therefore the bulk of the demand spreads out and the whole Bay Area is doing well. We will eventually reach a point of equilibrium, and the next economic downturn will bring them down. But we’re simply not there, just yet.
@SocketSite, can you explain to us what the point is of running your regular ‘SF condo sells below 2015 prices’ articles? These examples are clearly unrepresentative for the market trend (as seen above).
good question
Consider the fact that there are regular enough sales under 2015 prices for you to even ask that question.
All of which demonstrates the value of an index over individual sales.
First off, I think you mean “straw man” not “narrative” since you seem to be the only one hearing people say the market is already on the down slope.
Secondly, it’s almost September now and case-shiller is a three month trailing average with this data release being for April-May-June. So of course a three month trailing average from two months ago is going to lag data points occurring right now. It’s a given that any change in market direction will be seen first in the data points, then later in the stats.
Thirdly, would you even expect the market to go from straight up to straight down? Look at the last boom/bust with the multi-year period spent rippling at the top from ’06-’08.
From socketsite above: “And yet there are plenty of properties in San Francisco proper that still aren’t fetching 2015 prices”
I don’t think I’m the only one hearing people say the market is already on the down slope, nor is there any “straw man” at issue. For about the last 8 months, there has been a clear narrative here, or at least an attempt at one, trying to argue that the market is already falling (!!) Clearly not supported by the facts. And I agree with you that markets don’t necessarily go from straight up to straight down. And? From the numbers above, it is still going up. New highs, in fact.
“From socketsite above: “And yet there are plenty of properties in San Francisco proper that still aren’t fetching 2015 prices””
But again, you’re the one here confusing the fact that a number of properties in SF proper are selling for below 2015 prices right now with the fact that that an average index of the wider SF metro area went up 0.3% around four months ago.
And with a title “Index for Bay Area Home Values Hits New All Time High” the idea that it’s actually this post that is trying to deceive people is laughable.
So are you predicting that when this index “catches” up to these “representative” data points in a couple of months, the index will be lower?
I’m not “confusing” anything. These “down” examples the editor is fond of digging up and highlighting have been featured on this site for many months. They are well baked into this index except for, I suppose, the most very recent of the cherry-picked examples (and I’ve shown many counter-examples – not hard to find). But like I’ve said, hey, the market could go down. I’ve just been hearing here for many months that it is already down, which has now been proven incorrect. Keep saying it long enough, and it will eventually be right, I guess.
A while back, everything was rocketing up and the party line was that the large number of bidders for nearly every property represented a deep bench of buyers on the sidelines that would keep the boom booming. The ‘endless summer’ crew was out in full force. Then there were some leading signs of weakness, then some apples where market weakness could be inferred by backing out earlier years of appreciation, then flat apples, then down apples and now apples falling below even 2015 prices.
Meanwhile essentially you were telling us in June, that it wasn’t July. And in July that it wasn’t August. And surely enough now in August it isn’t September. All true of course, but it only serves to obscure the fact that summer is fading away into the distance and winter approaches.
Anything’s possible as you are fond of saying. Trump could declare himself Holy Roman Emperor and decree that next month is July. But that’s not what’s probable. People who act as if any reporting showing the change in market conditions from a few years ago to now is somehow beyond the pale are being ridiculous.
The Case Schiller posts are fairly neutral (though I feel as though there are more caveats for market increases) but there are clearly far more posts on this site with “apples to apples” comparisons for low/negative appreciation versus positive appreciation. Why is that? I am honestly interested in an answer.
Here’s what would help us determine whether the claim that “…plenty of properties in San Francisco proper still aren’t fetching 2015 prices…” is accurate: First take a look at all homes in SF that were sold in 2015 that were sold again in 2017. Then tell us what fraction were sold for more than their 2015 price and what fraction were sold for less. Some hard numbers like these would be much more informative than the “case studies” we have been seeing that all reach the same conclusion regarding falling prices, but which I treat as anomalies.
And if you had asked that question 2 years ago, everyone would have known the answer: not a single property sold for less than it had sold two years prior.
The fact that you are even asking the question represents a radical change.
From December 2014 – December 2015, the case shiller condo index was up 11.0%. The most recent case shiller 12-month condo index change was up 4,6%. That is indeed a radical change. But it’s not a downturn.
When we sold our old flat in 2014, winning bid was 20% higher than the next bid (thank you buyers!). If they had tried to sell during the next 2 years, almost certain the sale would have been at a lower price, despite the market rising significantly during that period. Anecdotes only get you so far. JM’s proposal is far better than selective anecdotes (but much more work).
The key is the trend, and that is the Bay Area performing at the national appreciation rate. Give or take. Within that, San Francisco is underperforming the rest of the Bay Area so some of the “contradictory” numbers can be explained by a more focused look at Bay Area appreciation numbers. Oakland versus SF for instance.
Seattle and Portland continue to outpace the Bay Area and the nationwide appreciation rate. A pattern likely to hold for the mid-term future anyway. One rental I purchased in Washougal in late 2014 is up almost 20%. Common story now in Northwest urbanized areas.
San Francisco prices are not crashing and few here seemed to have believed that. They are stabilizing and the next decade or so will see vibrant metros like Seattle and some of the Texas cities play catch-up. These numbers paint only a part of the picture. They reflect the largest 20 markets. Many medium sized markets are experiencing 10% or so appreciation year over year too. Look no further than Reno.
The Reno market (at least for homes under $600k, which is 95% of all sales) is going up dramatically. Reno rents are also climbing and the vacancy rate is miniscule. The market for homes above $600k is still a buyer’s market though as there is limited demand for the higher end homes.
There is close to a housing crisis because of all the new jobs and a dearth of new home construction – though that is gearing up. Teslaa, Google, Switch and others are putting huge flags down in one of the largest industrial parks in the world. Tesla is supposed to bring in 8K – 10K workers. If it decides to start manufacturing its cars in Reno all bets are off. The income level is generally “low” so hence the large, large majority of homes being 500K or less, That will change as engineers start being located in Reno. Plus the lack of state income tax makes the area a big draw for retired Californians. .
Reno is overlooked in Case Shiller because it’s a small metro but it is set to boom for the coming decade and should draw jobs from the Bay Area. . .
Well, it will likely boom, but not draw jobs from the Bay Area. The Bay Area has jobs AND Reno has jobs as an overflow from the Bay Area’s prosperity. Consider Tesla. The highest value jobs are still in the Bay Area, but its continued health is creating other good jobs in Reno.
Surprised the socketsite headline wasn’t “Bay Area Home Prices Move Barely Higher”. Editor is finally taking prozac? Or finally exited his dark room full of real estate conspiracy articles pinned over the walls?