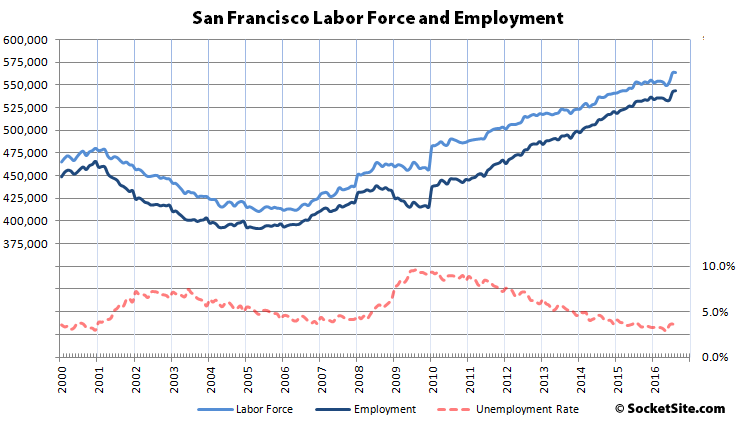
Having jumped like Kris Kross in July, the number of people living in San Francisco with a job increased by another 1,400 last month to a record 543,400.
And as such, there are now 77,900 more people living in San Francisco with paychecks than there were at the end of 2000, an increase of 106,700 since January 2010 and 11,500 more than at the same time last year with an unemployment rate of 3.5 percent.
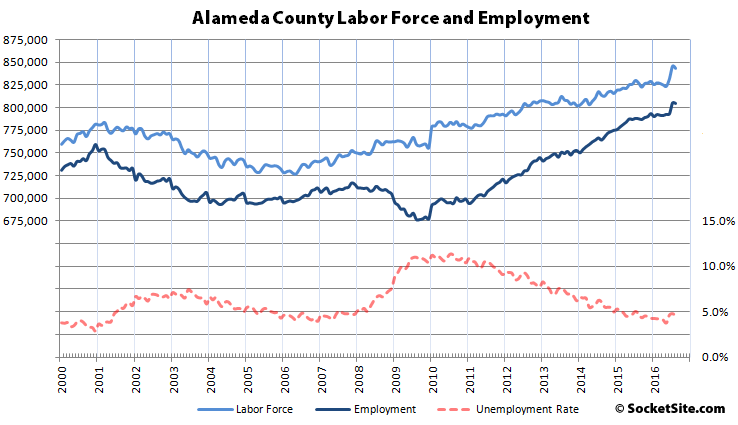
In Alameda County, which includes Oakland, employment slipped by 500 in August but the number of residents with a job (804,500) remains 16,900 higher than at the same time last year, an increase of 112,500 since January of 2010.
Employment across the greater East Bay also slipped in August, down a nominal 700 to 1,339,400, while employment in San Mateo County ticked up by 1,100 to 439,200 and jumped by 7,800 in Santa Clara County to a record high 1,011,900, which was the greatest month-over-month increase in four years.
Guess tech ain’t crashing
New unicorns in 2015 = 43. New unicorns in 2016 = 11. Not crashing, but that’s quite a drop.
What is your objective on here Sabbie?
Trying to get people to realize that the main driver for SF real estate is, at the most basic level, bubble finance.
In 2006 — yes. In 2016? No. Mortgage underwriting standards remain quite tight. There is nothing specific to SF about any financing trends (in housing or generally), and we haven’t seen SF-size housing gains in the rest of the country. Also, you keep saying that 37% of SF housing purchases are cash, so no bubble-financing issues there.
Now, if you are just saying that everything is in a finance bubble — housing, equities, commodities, etc,. — well, that evidence is even weaker.
Again, that’s not to say that SF prices haven’t gotten high enough to create substantial risks, imho. And I would not buy here now unless I could painlessly withstand a 15-20% price drop within a couple of years from now, which is a real risk, albeit unlikely. But the evidence of a bubble poised to pop is not there. No massive and growing defaults (like we had in 2006). No NASDAQ PE ratio of 175 (like in 2000). Just vague claims of money printing, and Austria, and “artificial” rates, none of which is evidence. I agree with your note of caution, but you are overstating it.
The Everything Bubble is quite real, it’s just absent from the mainstream media. We are now creating $3.71 of debt to get $1 of economic growth, and that debt is going to less and less productive use, and the growth is benefiting less and less people, and still the debt must be serviced. Sounds like a bubble to me.
“creating $3.71 of debt to get $1 of economic growth”
That makes no sense. I think you’re saying that for some period of time, the growth in total debt securities was 3.71X the total growth in GDP. That doesn’t mean much (for example, in times of recession, or negative growth, the growth in debt securities is infinity X GDP growth).
Regardless, even accepting your premise, the conclusion to be drawn is that we have a bubble in everything. So at least there is nothing special about SF housing in this picture. Also, with a finance-fueled bubble in everything, we must then have really high inflation! And we do, if you think 1.1% is high.
Sorry, I see the point you are making, but it doesn’t add up to a bubble (in everything or anything).
I’m looking at the chart of SF home prices since 1971, and it looks much more bubbly this time. Draw a trendline through the middle and compare the deviation in 2007 with the deviation today, it looks twice as high! This is in contrast to both the California and national housing markets, which only show about half the deviation today compared with 2007. In the last housing bubble SF peaked at $895k median, today we’re at $1.35M! Meanwhile CA peaked at $560k and is only back to around $500k. If you believe in reversion to the mean, we are in for it.
But if there were a finance-fueled bubble in everything, California housing prices as a whole would be bubbly. Yet they are still about 20% below 2007 prices in real terms. Would you consider a possible alternative explanation for SF housing prices, such as: SF has a net gain of 106,000 resident workers since 2010 (23% more) with only about 12,000 new housing units; hundreds of billions of dollars of VC money has flowed into the bay area since 2010; and hundreds of billions of dollars of new shareholder equity has been created in a number of very successful local companies (CRM, GOOG, FB, APPL, LNKD, etc.), who have added tens of thousands of new jobs? Might it be possible that those factors explain the recent rise in SF (and bay area) housing prices that is far greater than California or the nation as a whole? I’m not saying this will never slow down, or even reverse course, but the causes of recent SF housing price gains are really not that complicated.
[and, of course, inflation alone accounts for about 40% of the value of the median increase since 2007]
Yes, those billions of dollars flowing into local tech companies is exactly what I was referring to. There is plenty of speculative excess here, you just need to know where to look. Just one example here: Invasion of the Tech Borrowers.
OK, but if investors are continuing to clamor to funnel money to Bay Area tech companies, that doesn’t really harbinger any sort of imminent reversal. Just the opposite. From the linked article: “Buyers of tech debt don’t seem all that worried about history repeating itself in the sector [i.e. the energy slowdown following dropping oil prices]. Returns have been great this year, with the riskiest companies doing the best.” I agree that this may slow or reverse one day. From your linked article, that day doesn’t seem like it is coming soon. We might start worrying when investors and lenders stop being interested in putting money into tech companies.
“We might start worrying when investors and lenders stop being interested in putting money into tech companies.” New unicorns in 2015 = 43. New unicorns in 2016 = 11.
You act as if 1B valuations, for unicorn, is somehow damning? is it not also perhaps encouraging that valuations have become more realistic? You’re not necessarily saying what you think you’re saying with that, Sabbie.
11 new billion dollar companies (in 9 mos.) is a bad sign? When that number turns negative, that might indicate an imminent slowdown. Decelerating from 150 mph to 100 mph is very different from going in reverse.
Anecdotally you can look around and find a good number of startups and post-IPO tech companies with lofty valuations, large losses and shaky business models. More objectively, this professor keeps data on the tech and bio-tech IPO market. In 2014 only 17% of tech IPO’s were profitable dipping down towards the 14% lows of the dot com bubble #1 (1999-2000), in 2015 26% were profitable but the absolute number of IPO’s dropped by almost half. The median age of tech IPOs hit 11 years which dovetails with anecdotal evidence that many of the companies this round have been plugging away for a very long time without finding a way to become profitable. At some point investors may simply lose patience and stop dropping money into a pit.
Looking at housing, the economist has a nice interactive chart. They used to chart price to income on an absolute scale, I believe for SF it was around 9 last I checked, now they’ve switched to a scale relative to the long run average. The long run average being set to 100 and we’re now at 144. To quote them: “Yet in some cities, such as San Francisco, affordability looks stretched when compared against income—prices in the City by the Bay are 40% above their long-run average when compared to income. Theory suggests that they should eventually fall back down to earth.”
And again, this is not just prices but the price to income ratio that is approaching the heights of the last bubble.
Anecdotally, we’ve had more than one person here on SS talk about buying at 8-9x income, some even in marginal areas such as the Bayview. Not that hard to find similar stories of people stretching to get into housing.
So I think that’s more than just a vague notion of frothiness.
And now with price reductions increasing, inventory increasing, signs of weakness in the condo market and in some rental areas there’s some indication that these lofty heights may not be sustainable. There’s also been some signs in tech of growing discomfort with high valuations for profitless companies.
“Buyers of tech debt don’t seem all that worried about history repeating itself in the sector. Returns have been great this year, with the riskiest companies doing the best.”
This is just talking about bond buyers. If you buy some bonds and sell them to some other sucker for more than you’ve paid, you’ll have great returns. But what happens to the companies that take on all that debt?
“To pay back the money borrowed in the buyouts, then, the PE firms need to drastically improve profits at tech companies that in some cases seem to be in permanent decline.”
If you have little to no profits and now have to make debt payments that’s going to put an additional strain on your operations. The “profits are for losers” mentality might be in for a rude awaking when payments to creditors come due.
Pop Goes the unicorn (Bay Area unicorn Mode Media shuts down, leaves bloggers unpaid): “Bankruptcy appears to be a possibility. It would be the first so-called unicorn based in the Bay Area to face such a fate. While others have been gobbled up in acquisitions or forced to accept lower valuations in financing rounds, none of the companies publicly tracked on lists of unicorns has simply gone under.”
I think Glam was at one point valued at 1B, based upon something it had acquired, and its preliminary filing for an IPO? then it never did, and changed its name. But Mode Media was never valued at 1B. Right?
The data and correlations are very strong: by far, jobs – and highly paid ones are so common here – are the number 1 driver of Bay Area real estate prices. Assertions otherwise are unfounded.
If we’re talking non-US, foreign investors in late stage funding rounds, not foreign RE buyers, are the real story. I do think this money will dry up eventually, as many will take a bath as companies never deliver. Then job losses will follow. But it could be 2, 3, 4 years.
In the meantime, par-ty like its 2015…ta ta, ta ta ta
By then the market will be up another 40%. Buy now.
Nice try Mr. Realtor
“correlations are very strong” Hm, I missed that part of the article. Did you calculate some R values for the various factors that drive home values? Where are you getting your data from? The fact that 37% of sales were all cash tells me that there are other more important factors at work. I know we have some well paying jobs here, but there can’t be that many jobs that allow you to quickly save up $1.3M.
sabbie, not surprising you don’t read widely enough to know about historical national correlations of income to home prices. I’m not going to Google for you. Or, think of me of just making up assertions….like you do. With a tone of supreme sureness, of course.
Also, you should learn what a “cash” purchase is. Hint: the definition is much broader than you know.
You are the one making assertions without support. Again: please provide one shred of evidence that SF home prices today are strongly correlated with employment. Historic is irrelevant, because interest rates have never been this low for this long, and affordability is also at an all time low. National is also irrelevant to SF as we all know.
Even if there is some correlation, it does not equal causation.
Again with the nominal interest rate fascination…ugh.
It is pretty well accepted that low interest rates push investors into riskier assets and behaviors.
My complaint is your use the of the word “low”. Defining interest rates as low now because a number is lower than it was at some other time is incorrect. You need to look at real interest rates, which you keep ignoring.
In this case I’m strictly talking about interest rates from the perspective of retail “mom and pop” investors.
Why? You can’t say “show me evidence!” when you admit that you’ll dismiss all historical evidence because this time is different, and then proceed to say that you’re only considering one tiny sliver of the economy to prove that this time is different.
Why, because these are people who listened to all the right advice in order to prepare for their retirement, and then got the rug yanked out from under them by Yellen and Co. In the words of Willy Wonka, you get nothing!! And now they’re looking to rentals to save them. It’s not just savers and retirees but it’s pension funds too. Meanwhile, the National Institute on Retirement Security (NIRS) recently found that the average American household has $2,500 saved for their retirement, while those near retirement (aged 55-64) have only set aside $14,500 which should last a few months if they don’t get sick.
And yet you want Yellen to raise interest rates to slow the economy? You’re making very little sense here. Raising rates will cause Americans to save more? What?
At this stage, the economy is slow BECAUSE of low interest rates, not IN SPITE of low interest rates. How many decades of these low rates do we need until things pick up? Maybe you should ask Kuroda and Abe that question. Low interest rates are SUPPOSED to force people into spending, but because they can’t get any interest towards their retirement, they ACTUALLY save instead. This has been quantified. The Fed was dovish today for one simple reason, to protect their good pal Hillary and her cronies on Wall Street until November.
Exactly. Which is why we need to switch from this fascination with nominal interest rates and actually do something that increases NGDP and/or inflation. Sitting on 0.5% and claiming it’s low and “expansionary”, when inflation chugs along at barely over 1% is ludicrous. When will the Fed be held accountable for actually hitting its 2% target?
The problem is that the Fed lacks the tools to get 2% inflation. When you have a hammer, every problem looks like a nail. Instead they are causing desperation for yield which only leads to malinvestment and asset bubbles. If you don’t believe me, maybe you’ll listen to Bill Gurley.
A central bank that literally creates the currency does not “lack the tools” to create inflation. It may lack the political cover, but that’s it.
Answer my question, what do you propose it will take? A decade more, two decades more, of zero rates? Negative rates, ban cash, buy up all of the equities and corporate bonds? And then please show us some real world examples where the proposals have actually proven themselves to create the magic 2%.
How about just credibly say that you’ll meet 2%? That hasn’t been done. Then do what it takes to hit it. After you hit it, the expectations fairy takes over. That’s why economies like Australia, that have credible central banks, tend not to hit the zero bound, where others are seemingly stuck at the zero bound because they haven’t even bothered to try to leave it. Anytime we approach 2% massive tightening has happened – and continues today, where ludicrous talk of a rate increase is being discussed when even the Fed’s own projections show sub-2% inflation for as far as the eye can see. Why in the world is this allowed?
Can you show me a case where raising rates has led to an expanding economy? That’s what you’re proposing.
Simply put, the problem is that the low rates have overheated certain parts of the economy (high risk assets, corporate credit) while others (real productivity) have languished. The Fed knows very well that the longer this keeps up, there’s no real benefit, but the crash will just be that much bigger. They’re just putting off the inevitable until after the election. And before you ask about the fascination with rates again please read: Is Fed Policy As Potent As Yellen Thinks It Is?
“overheated certain parts of the economy (high risk assets, corporate credit) while others (real productivity)”
That’s the setup to future worrisome economic problems.
People react to low nominal rates by loading up on debt. But then don’t have the tailwinds of inflation or high productivity growth to help them pay down the debt.
For an older generation, purchasing housing with a fixed rate loan worked out spectacularly well due to periods of high inflation which seriously reduced the real value of that fixed rate debt. Productivity gains which increased real wages provided an additional tailwind.
Now, low nominal rates might let people lever up to buy at 9x income and let marginal tech companies load up on debt. And as long as housing prices and tech valuations keep going up, the piper never needs to be paid.
But when prices flatten and the reality sets in of running a household or company in a financially sustainable manner while servicing that debt without the tailwinds of inflation and productivity growth, many may find they are in over their heads.
The big problem is that lowering rates actually does help lift the economy out of recession and generate inflation to a certain point, but now that they’ve missed their window (was probably 2013-2014) and are stuck at zero, what are they going to do?
So what both of you are claiming is a problem is the lack of inflation…the exact same thing that I’ve called out. So why not force the Fed to live up to their mandate?
And no, the Fed is not “out of ammunition”. A central bank that creates money out of thin air can always create inflation. They simply don’t want to, which is why they need to be held accountable.
No there is plenty of inflation, the problem is that it is in the wrong places, as you can see here.
My point was that inflation helps those with fixed rate debts. Yet now, people are loading up on debt even with low forwards looking inflation forecasts. People’s actions are not always rational.
Ah, the old goldbug inflation conspiracy theory. Ok then.
This year, the ECB printed nearly 600B euros with QE. At the same time, GDP has increased by 31B euros. So to “generate” 1 euro of GDP growth, 19 euros of debt were incurred. And their GDP is actually still dropping. How people like you could advocate continuing on this insane path of utter failure is completely beyond me.
This year, the ECB printed nearly €600 billion within the frame of asset purchase programme (QE). At the same time, GDP has increased by… €31 billion
Has the ECB committed to 2%+ inflation? Absolutely not. How people like you can continue to let central banks off the hook for doing their job is beyond me.
The amount of QE they’ve done is irrelevant, when they won’t even commit to what their job is. The market correctly believes that they’ll do some QE but then let inflation sink back into [deflation], so the QE they’re doing now has little to no effect.
That’s why people look at price to income ratios. And when the price to income ratio deviates strongly from historical norms, such as in the 2007 bubble and in our current situation, it’s a clue that something odd is going on.
Well that explains the horrific traffic in San Francisco.
+9,900 jobs in July, +1,400 in August, but these were all “expected” and due to “seasonality,” so I am sure we will see employment take a nose-dive come September reporting. Hopefully without a brutal pop hip hop reference. I mean, for plugged-in readers, the huge overhang of housing inventory and crashing condo prices mean this job thing is a mirage, right?
I thought all jobs were moving to Oakland? Maybe Dave can clarify what’s happening here.
Boris: It’s VALLEJO now. After all, there is a ferry connection.