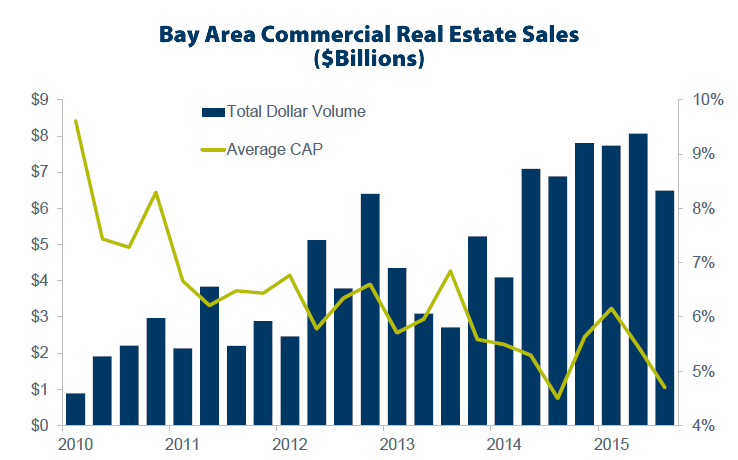
$6.49 billion of Bay Area commercial real estate, defined as properties valued at over $5 million apiece, traded hands in the third quarter of 2015, down 5.7 percent from $6.88 billion in the third quarter of 2014 and a 20-ish percent drop in dollar volume from the second quarter of this year, according to data from Cushman & Wakefield. And the trailing 12-month average has been trending down.
That being said, the dollar volume last quarter was 44 percent above the quarterly average of the past five years and total sales in 2015, which currently tallies $22.4 billion, will likely surpass 2014, which would make 2015 the second highest total dollar volume year on record behind the $34.9 billion recorded in 2007.
The average CAP Rate across all property types – office, industrial, retail and multi-family – was 4.7 percent last quarter versus 4.5 percent at the same time last year, but the uptick was driven by an increase in the CAP Rate for retail properties and CAP Rates for the other classes actually compressed, with the average CAP Rate for office properties dropping to 4.3 percent.
Roughly 9 percent of Bay Area investment property sales have been to foreign entities so far this year.
is 9% foreign high, historically? I’m guessing yes?
I’d like to know the commercial cap rates in other markets.
The cap rate has fallen overall since 2010 as the commercial prices here have climbed. Makes sense as the graph makes clear.
I’ve purchased homes out of state recently and the cap rate is higher than SF for sure but even the Central Valley. Turn-key properties conforming to the ISO standard developed by the group I’m involved with. Turn-key can be very misleading and one has to be careful.
The cap rate is higher on single family rental homes in many good markets outside the Bay Area and It’d be interesting to see what it is on larger commercial properties.
This data is simply wrong and Cushman & Wakefield’s junior researchers made a mistake. No commercial real estate professionals active during 2010 could identify almost $1 billion of sales transacted at an average 9% cap rate in an quarter. Cap rates during 2014 to 2015 have also not been as volatile as the chart shown. The sales volume during certain quarters is also suspect.
If you have better data, perhaps prepared by a senior researcher or two, please feel free to send it our way (tips at SocketSite.com).
With respect to the CAP rates, we wouldn’t get too caught up in the individual data points, especially considering they’re averages across all sectors and areas, the story is the trend.
I agree with Real Estate Guy. I call BS only a fool would post this up and believe it is accurate. 9%+ CAP, give me a break. Do you also believe 8% GDP in China?