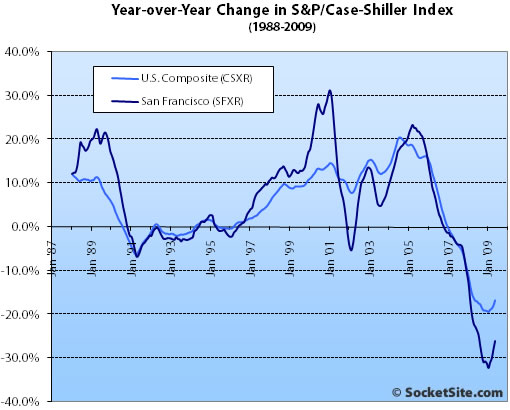
According to the May 2009 S&P/Case-Shiller Home Price Index (pdf), single-family home prices in the San Francisco MSA gained 1.4% from April ’09 to May ’09, down 26.1% year-over-year and down 45.0% from a peak in May 2006.
For the broader 10-City composite (CSXR), home values gained 0.4% from April to May but are down 33.3% from a peak in June 2006 (down 16.8% year-over-year).
As of May 2009, average home prices across the United States are at similar levels to where they were in the middle of 2003, indicating that the three years of appreciation that occurred from 2003-2006 were all given back in the following three years. From the peak in the second quarter of 2006, the 10-City Composite is down 33.3% and the 20-City Composite is down 32.3%.
San Francisco MSA single-family home prices continued to fall across the bottom one-third in terms of price tiers but showed gains at the top.
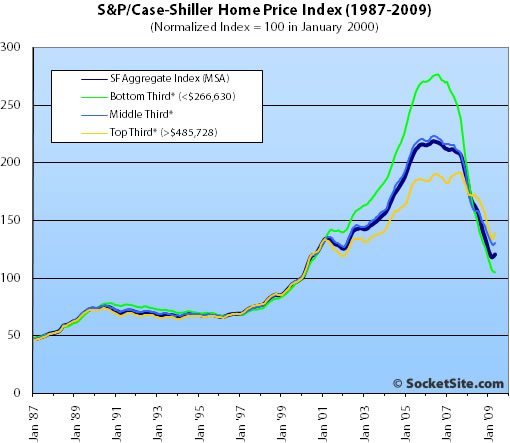
The bottom third (under $266,630 at the time of acquisition) fell 0.5% from April to May (down 33.3% YOY); the middle third gained 1.0% from April to May (down 18.2% YOY); and the top third (over $485,728 at the time of acquisition) gained 3.8% from April to May (down 19.6% YOY).
According to the Index, single-family home values for the bottom third of the market in the San Francisco MSA have retreated to March 2000 levels having fallen 62% from a peak in August 2006, the middle third is hovering around March 2002 levels having fallen 42% from a peak in May 2006, and the top third is back to November 2003 levels having fallen 28% from a peak in August 2007.
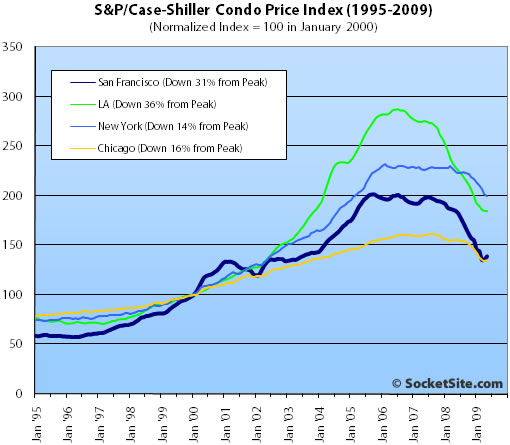
Condo values in the San Francisco MSA gained 2.3% from April ’09 to May ’09, down 24.7% on a year-over-year basis and down 31.0% from an October 2005 high.
The standard SocketSite S&P/Case-Shiller footnote: The S&P/Case-Shiller home price indices include San Francisco, San Mateo, Marin, Contra Costa, and Alameda in the “San Francisco” index (i.e., greater MSA) and are imperfect in factoring out changes in property values due to improvements versus appreciation (although they try their best).
∙ Home Price Declines Continue to Abate In May According to S&P/Case-Shiller [S&P]
∙ April S&P/Case-Shiller: San Francisco MSA Top Tier Flatish, Others Fall [SocketSite]
I am a little confused with the top tier report. Maybe it is because this is July and, the report is disaggregating data from a few months ago…
But…um…doesn’t it look that there is an overabundance of $2m+ homes on the SF market now that aren’t even moving? I wouldn’t call that flat…I would call that a train wreck in the making…someone shine some light on this. I could be wrong.
As calculated risk noted today, c-s released the seasonly adjusted numbers after the non-adjusted numbers. The SA numbers do not show an uptick at a national level.
[Editor’s Note: The seasonally adjusted numbers for San Francisco more or less reflect what we wrote above: a drop in bottom tier, relatively flat in the middle, and a bump at the top.]
We continue to be in a free fall.
I’m on the phone right now with my friend, the MIT professor, and the two of us will find SOME way to pessimistically interpret this data. So don’t worry, the bloodbath has a ways to go. $400/sqft in Pac Heights is still gonna happen.
Will get back to you guys…
Seriously, I’m having trouble determining what on this board is sarcastic anymore. Do the authors even know?
Hehe. I was being sarcastic.
People around here refuse to acknowledge any positive news, and will find whatever pessimistic lining is out there.
The unambiguous evidence suggests that thing’s have leveled, and are possibly improving. Yet, you won’t hear that on Socket Site.
The reason I suggested that some pessimists need to learn to act like men is that uninformed pessimism clouds real estate investing judgment. The charts and graphs will not buy you a house. You need to back away from your graphs and get out and make things happen.
Pumpkin Patch’s point is a good one. Prices have fallen so much at all price levels, and sales volume at the higher end has plummeted, so that the CSI tiers have less and less relevance to the most interesting trend in SF real estate — the collapsing high end. $485k to reach the top tier is nearly half off the level of two years ago!
Btw, here are a couple of Pac Heights places (one sold, one listed — there are others) in the 500s/sf. Wouldn’t surprise me at all to see places hitting the 400s within the next year.
http://www.redfin.com/CA/San-Francisco/3242-Washington-St-94115/home/588415
http://www.redfin.com/CA/San-Francisco/2001-Sacramento-St-94109/unit-5/home/1659165
With this sudden and (lets face it, unexpected..) turn around in the index, does anyone know what changes there have been to the futures indices that are traded?
I assume lots of people on this site were way short on these.
Hey, even the (purchase price) tiers have ticked-up MoM, however they are substantially lower from a year ago. I would assume this indicates that the houses that are selling this year have either been held for longer, or are of lesser quality.
The last time we had a tier up-tick was in Nov’08 and that reversed the following month. Only time will tell if this uptick will also do the backstroke in 30 days.
Just a reminder; houses that were considered to be in the lower-third in Sep 2007 would now be considered upper-third properties. It was wideley argued at that time that upper third=SF, (including district 10). Is this still the opinion of the pesters here?
I’ll re-post the running stats for the MSA thirds.
Month…Upper 1/3….Lower 1/3
Sep-07..$860K……..$614K
Oct-07..$853K……..$605K
Nov-07..$834K……..$586K
Dec-07..$816K……..$566K
Jan-08..$794K……..$545K
Feb-08..$756K……..$513K
Mar-08..$734K……..$589K
Apr-08..$722K……..$474K
May-08..$722K……..$474K
Jun-08..$707K……..$447K
Jul-08..$696K……..$432K
Aug-08..$675K……..$410K
Sep-08..$648K……..$386K
Oct-08..$562K……..$321K
Nov-08..$592K……..$342K
Dec-08..$561K……..$321K
Jan-09..$527K……..$298K
Feb-09..$502K……..$281K
Mar-09..$482K……..$268K
Apr-09..$479K……..$265K
May-09..$486K……..$267K
I’ve been looking somewhat seriously at 3/2 SFH and condos in districts 5 and 6 and nice places down 10-15% from the peak seem to be moving. I wonder if an uptick in activity in those types of places is moving the median.
Regardless, things seem to be bottoming for those types of places. It could be the calm in the story, we’ll have to see.
i bought in the middle tier last month. let’s roll the dice! is this ma
any agents out there have a perspective about any uptick in foot traffic and sales velocity they’ve seen? all i know is that if it’s priced right it seems to be selling.
This probably has more to do with the stock market recovery than anything else. Take from that what you will.
Newbuyer, anyone who thought it would go straight down forever was off their rocker. Even the Dow in the great depression went up at times. In this case, it’s tough to tell whether this means anything or not, because the amount of the uptick is under the margin of error. So the graph can tick up, while the actual ticks down, but I’m sure we’ll have a few genuine uptick months until February, when it will start strongly down again.
UnwarrantedInLaw, that stupid technique (“Be a man and make something happen”) may have worked on stupid buyers in the past (and possibly you), but I doubt it will work again. Real men know when to stand up to a collapsing market and watch the wussies who can be suckered into buying, do so. Anyone who buys now is a fool, uptick or not.
A slight uptick does not a turnaround make.
Pumpkin patch, not sure on how many 2m+ homes there are compared to, say a year ago.
But certainly there are less SFHs in total than there was 12months ago.
But I agree a breakdown would be useful!
Anyone who buys now for any reason is fool. You hear that Chris Daly, you are double stupid.
The end of the apocalypse is nigh!
…or not. Personally I think the CS index will go well below 100, otherwise you have to believe that *this* bubble denouement is different from the others.
REpornaddict…
I agree that a breakdown would be useful. I have a friend who sold their <$1m home in two weeks last month…but, what I saw this weekend was a “Name Your Price Game” for more expensive homes…and, the game is NOT a bidding up war, either…
Someone shine some light on this, please.
This so reminds me of SO CAL in 1996. Prices starting ticking up, and (in the early days of the chat rooms) they were all dismissed as “blips” “dead cat bounces”, or “the data is flawed” etc. etc.
I thought with the wealth of data out there, that we wouldnt see that again. Yet even if this is not the bottom, I am now certain there will be a sizeable minority that will always see more downside to come. They say bottoms can be hard to see til after they are long gone – now I understand why.
bottom here.
30% down = bubble drop.
4 years to get back to 2006 prices
Let’s be clear here.
I’m not saying that this is over, or that prices are on their way back up. What I’m saying is that we have now received back-to-back months of improvement. There is really one takeaway, and it’s a positive one:
The free-fall that began in April ’07 has now ended.
Since then, there has not been a single month of gain. We just had two straight months of gain. This does not preclude future tumbles, but it means that this current two-year free fall is officially behind us.
If there is another dip, then it will be an aftershock, and my guess is that it will be a rather diminutive one (CS will not go below 110 from hereon-out is my prediction).
UnWarrantedInLaw,
I’ll be a man. I’ll put some money down. Let’s have some fun and see who’s right. I’ll put $50 on the top tier being lower by the end of the year. Maybe the socketsite editors can hold it in escrow? :p
For many people here prices stabilizing or going up is not “positive” news. One could argue that real estate agents who, with seemingly nothing better to do, come here and post the “now is the best time to buy” crap are being incredibly self-serving. To those folks I suggest you “put down your coffee” and go out and get another job. You appear to be among the “bubble realtors” whose careers will not survive.
Nevertheless, after unprecedented government interventions, the free fall seems to be over.
Unemployment will keep home prices from rising – in fact in SF over the next few years they are likely to come down a few points more. Also, most lenders are still asking for high down payments. This combined with diminished portfolios means a smaller pool of potential SF home buyers.
Bottom line, if you find your dream home priced reasonably, can swing the financing and plan to stay for at least 10 years, go for it. Why not? It’s only money.
If you look at a logarithmic version of the CS chart you will see that there was a strong upswing in early ’91 although the market continued to trend down for another 5 or so years.
It would be great if the editor could post a log. chart so we can see the magnitude of previous intra-trend increases and declines more easily.
200B. Clear!
— Sorry no pulse
300B. Clear!
— Still no pulse
500B. Clear!
— Nope. I think we have to give all we’ve got, Dr Bernanke.
780B. Clear!
— We have a pulse. Pretty weak and still unstable. The whole country is out of juice though, we sucked all the power to revive banking and housing. Consumer is dead. Worker is dead. But at least salesmen and traders are happy.
You hear that Chris Daly, you are double stupid.
I know you’re being sarcastic, but personally, I think Daly might have been a bit early. Fairfield by the numbers: 1748 homes in foreclosure (NODs, NOTS, bank owned) to 222 homes for sale. I’d say there’s a bit of pent up supply that will continue to drive prices down. And amazingly, this will affect SF home prices…
lol “unexpected”.
Under the zombification/solvency tax thesis this is completely expected. And it will get even better going forward (this is only Apr/May data).
Good thing too – I’ve seen bowling balls bounce with more vigor.
The bottom tier did not bounce because solvent folks do not buy down there, except perhaps as investment where things must pencil out explicitly.
In the bay area, with interest rates “so low”, why would a solvent buyer (downpay+credit+income) purchase a bottom tier house when they can easily move up into the next tier? Even an FHA buyer could stretch into the next tier easily, if I understand that program correctly. Jeesh, the top tier acquisition price is practically under the conforming limit now!
I still don’t know where the jobs are going to come from, and how they are going to get the deficits under control.
But as long as you are buying with at least 20% down, it’s none of my business. Enjoy your home, and as a taxpayer, I thank you.
people do realize that the graph is acceleration and not a price index, right?
as long as the lines are below the x-axis, prices are still going down.
free fall may be over, but that doesn’t mean the fall has stopped.
“The unambiguous evidence suggests that thing’s[sic] have leveled, and are possibly improving. Yet, you won’t hear that on Socket Site.”
Bet you NewBuyer will eat those words when we see fall/winter data when nothing is selling and we’ll see this is a seasonal blip (I’ll even suggest that some of the seasonally adjusted prices will go up for June and maybe even July data). The high end will continue to fall, and again, as people have mentioned, median prices might go up because the mix of houses changes.
Nothing to conclude here, move along.
Its so funny, a year ago, when govt intervention was being tossed around, all you heard here was “it wont do anything” “it wont work” etc, etc. etc.
Now those same people are saying the ONLY reason the cliff diving stopped is because of the government intervention – LOL
NewBuyer, you’re wrong on April data. Seasonally adjusted data shows things went down in April.
At some point the fall has to stop or take a breather. Bear markets often stop when moderate bears turn bulls and are subsequently brought to the cleaners. A blip on the curve is a good way to get that to happen. See you in a year!
I’m thinking prices will get back to the 1999/2000 range in a year or two, and then a couple more years for the market to adjust. The bottom is going to last for a while.
I’m going to wait until listing prices are competitive from the start. Currently, it seems for many listings the seller ends up lowering the asking price (at least once), and the property still doesn’t sell. Either the property remains unsold (and the true price isn’t reflected in the general market), or the listing is withdrawn (and the true price isn’t reflected in the general market). The bid/ask diparity is too great, and is creating an inefficiency in the market.
Until the average seller is more realistic with asking prices, inventory will not move and the real market price will not be realized. It’s going to take serious time for seller’s to come down from the koolaid they were drinking for the years up through 2007.
But what do I know?
from newbuyer.
“(CS will not go below 110 from hereon-out is my prediction).”
Want to make a friendly wager?
I bet CS index for SF MSA goes below 110 before march 31, 2010.
Wager $250 to local charity? If I win, I choose charity. If you win, you choose.
“you’re wrong on April data. Seasonally adjusted data shows things went down in April.”
I am loving all this seasonally adjusted stuff. Two words you NEVER heard on a case-Shiller thread until umm..last month.
It certainly wasn’t being banded around in the depths of winter.
And yao, yes, the YOY price decline is still negative. But prices are still going up. The index is higher now than it was in March or April.
Sorry REpornaddoct, I didn’t realize that I was the only one on SocketSite who talked about seasonally adjusted numbers (as I did last month). Calculated Risk mentions them all the time. I am relatively new here, and if we’re going to compare apples to apples (as seems to be a theme on SS), seasonally adjusted numbers are necessary.
REpornaddoct/REpornaddict
you’re mistaken. yao is correct.
As long as the index is below zero, prices are falling YoY. It there is an uptick (still below zero) then they’re falling more slowly than they were 2 months ago. Whether they’re coming up depends on the relative levels of prices 12 and
14 months ago, respectively. But you can’t tell easily from the chart.
As yao said, that’s an acceleration (actually, velocity) chart. To determine absolute price levels you’d have to integrate it over time. As long as CS is negative, we have a downward trend.
LOL on the “act like a man” comment from UIL. Wasn’t he the one talking about the Lebanese community buying?
These guys probably aren’t Lebanese, but I thought this video from “Ausaf and Zubair in Irvine, CA” was pretty funny:
http://www.youtube.com/watch?v=rCWnL8QIkr0
(“Act like a man” is about 1:50 in, but the whole video is pretty funny – terrible sound quality, though.)
REporn:
CR does mention the NSA vs SA numbers often and has mentioned in the past that the numbers in the winter are likely overstating declines, and the numbers in the summer will understate them:
http://www.calculatedriskblog.com/2009/04/house-prices-compared-to-stress-test.html
“Prices usually decline at the fastest rate in the winter months (or increase the least with rising prices), and prices decline the slowest during the summer. Just something to remember when the month-to-month price declines slow this summer.
and to be fair, it appears that the seasonal patterns have become much more pronounced in the past couple of years, thus the seasonal adjustment may or may not be adequate
my take is that the ‘stickiness’ of housing prices and thus their slight need for seasonal adjustment has changed due to the high foreclosure rate – namely house prices have become less sticky (especially at the low end) of late,
http://blogs.wsj.com/developments/2009/07/22/as-housing-loses-its-stickiness-prices-reach-bottom-quicker/
and as such this has caused the seasonal effects to become pmore pronounced (both up and down).
http://www.calculatedriskblog.com/2009/07/case-shiller-house-price-seasonal.html
“It was wideley argued at that time that upper third=SF, (including district 10). Is this still the opinion of the pesters here?”
HappyRenter, “pesters” cracked me up. Don’t mean at all to be the grammar police – just wanted to thank you for the laugh.
“[this year they’re saying] the ONLY reason the cliff diving stopped is because of the government intervention – LOL”
Much of the intervention (the parts they’ve admitted to) was actually illegal a year ago. I’m laughing out loud too!
I still don’t know where the jobs are going to come from, and how they are going to control the deficits, though I’m not sure how much of this year’s deficit hasn’t been spent yet “LOL” 🙂
I wasn;t talking about CR (Calculated risk? – never heard of that until today). I was talking about this site only. Certainly no one claimed here in winter that the declines were being overstated in winter due to seasonality.
As for the grapsh, if prices rose 30% next month then we would still be below 0% YOY, but prices would clearly be rising – you can tell from the index (the second chart) whether prices are falling or rising. For the last two months they have been rising.
Yup, if prices ever increase it is always due to ‘seasonality’ or ‘the mix.’ But if prices decrease it is always fundamentals.
I’d say volumes have bottomed and prices will bottom by the end of the year.
It’s completely possible that Gov’t intervention may have turned the tide on nominal RE pricing, and two years from now said nominal pricing will be up 10% from today. If that’s the case, the bulls can toast each other with $5/gal. milk.
It’s hard to distinguish parody from delusion in threads like this!
Wake me when the existing inventory and unemployment levels are low enough to reasonably expect price appreciation.
UnWarrantedInLaw,
I’m feeling rather manly today as well. I’ll also put $50 on the top tier being lower by the end of the year. That’s $100 if you win.
The charts and graphs will not buy you a house you know. You need to back away from your graphs and get out and make things happen. Act like a man! Take the bet. $100 would be a fine start towards that macho Syrian dream house.
Or you could buy another medallion and get it tangled up in your chest hair.
Wake up J, there has been price appreciation for the last couple of months…
Great link, and a great reminder regarding “how to act”, LMRiM! I’m acting like a PATIENT man…I’ll give it a year, or two, or three, before I even start seriously looking into buying in SF again…
Here’s a good chart showing the seasonal patterns in Case Shiller housing prices nationally:
http://4.bp.blogspot.com/_pMscxxELHEg/Sm8Qy9GjzAI/AAAAAAAAF7s/deUYRxiFWDM/s1600-h/CaseShillerSeasonal.jpg
I would like to see San Francisco’s raw numbers in a chart like that and I bet we would see the same seasonality. There is so much seasonality that a year over year chart is much better way to smooth out the volatility.
And looking at Socketsite’s San Francisco year over year chart, above, it shows we just bounced off the ocean floor and are slowing ascending, still leagues below the surface. How much lower could we have gone? Over 30% year over year is amazing. We’ve already had over two years of decreases.
If the rise from the depths is at the same rate as the decrease we won’t get back to year over year increases until Spring 2011. That’s a lot of ascending from the deep. That would be over four years of mostly double digit decreases.
That the best case scenario: a drastic shooting up of the yoy numbers (the Spring 2011 recovery). A recovery like we had in the mid 90s is more likely, with a slower ascension and probably not reaching mostly positive year over year increases until 2012 or 2013. That scenario would be over 5 years in negative territory.
Let me know when someone sights the surface (year over year increases).
Yup, the chart is the velocity of annual change. Yao notes that a positive slope of velocity (acceleration) still means YOY declines or a downward trajectory. Raise your hand if you paid attention in high school physics and understand that slowing negative velocity is still a downward trajectory.
Some more positive news! Keys are in the mail for 333 Bush.
S.F. tower’s owners will forfeit it to lender
“The owners of a premier San Francisco office tower plan to forfeit the property to their lenders, the city’s second distressed transaction involving a major commercial building in recent weeks and another sign of the growing pressures in the sector.”
At least all the investors were “value players”:
“More distressed deals are expected. Nearly three-quarters of Class A office buildings downtown sold between 2005 and 2007, a bonanza that drove up prices to all-time highs and squeezed the ratio of rental income to cost to record lows.”
http://www.sfgate.com/cgi-bin/article.cgi?f=/c/a/2009/07/27/BUD218VMTC.DTL
[Editor’s Note: News indeed but a few days old: 333 Bush: Bought For $281M In 2007 But Now Going Back To The Bank.]
That blip up looks suspiciously like the amount of the first time home buyer credit.
Andyc,
I noticed my mistake after I posted, but it gave me a laugh too, so I didn’t try to correct it.
Ahh – as a former resident of SF, I love seeing this. Years ago, I watched with great interest as the housing bulls and housing bears duked it out. At the time, it was so clear, the bears were mostly on point, and the bulls were clearly in denial.
I quit following US property values 3 years ago – yet these case shiller results made me perk back up.
To my amazement, the shoe is now on the other foot, the bulls have the upper hand, and now it is the bears who are in denial.
No offense to any of you – I quit the SF rat race years ago. However, as patently clear it was to me that the bulls were wrong and the bears were right back in 06, it is exactly the reverse situation here in 09. Bears, keep in mind, denial is not just the province of the bulls.
See YA!!!
To my amazement, the shoe is now on the other foot, the bulls have the upper hand, and now it is the bears who are in denial.
Unemployment at 10%, consumer basically scared $h!tless as a consequence and way over-indebted anyways, commercial RE doing its own free-fall wiping out more paper wealth, banks still not marking to market (a really big deal), rez and commercial rents coming down, tech profits coming from lower costs due to layoffs, credit still tough to get by without 20% down and great FICO score. But RE is kinda going up after the Mother of All Plunges.
Let’s see…
Nope. Still a bear.
This reminds me of 1992 Europe. Everyone giving a big sigh recession was over. RE went on to decrease for 3-4 years as banks were unwinding the bad choices from the late 80s. I think this is the same situation except the recession went way way deeper and global.
@FronziScheme:
How many of the economic stats that you just mentioned are TRAILING INDICATORS?
And as for this “corporate profits are nothing more than cost cutting” nonsense… so what?
A dollar earned is a dollar earned.
Google and Intel will continue to be profitable next quarter, and will still hold back from hiring. Then they’ll be profitable in 1Q10, and will refrain from hiring yet again. But by the middle of 2010, after three straight quarters of profit, they will begin to scale up their business.
2011 isn’t so far away anymore… and there’s one fewer free fall between us and that date.
NewBuyer, 2011 is also my bet for the real recovery. How strong will it be is the question.
Let me expand a bit: the economy must find a main powerhouse. It will have secondary ones (renewable energy, tech, auto which will make a huge comeback imho). We got out of the early 90s crisis thanks mainly to the tech boom. It started with the profits from gains in productivity (91-96) thanks to tech investments in the late 80s. These gains were re-invested into more technology once things were clear enough and it became its own powerhouse (97-2000).
The current “recovery” is mostly free money lent to the banks plus recovery package money. Tech companies are getting ready for the next leg up I agree, but where do you think this expansion will come from? Maybe it’s under our noses and we do not see it. Any idea?
Hasawakano,
Yeah, I think the bulls are always bulls and bears always bears. The data just happened to be on one side or the other.
Two sets of dead clocks, each right twice a day.
Meanwhile, most people in the middle don’t bother to post.
john,
That’s not always true. Other people look at fundamentals and for instance see that rents are less than 1/2 of owning costs for many places in SF and deduct that the market is overpriced. If I see rents in par or more than true owning cost, then I’ll be a bull. I saw this situation before and that’s when I was loading up on cheap cheap RE in the 90s.
Same thing for the economy. Too many things are to be resolved for anyone to declare the storm over. But once things are more clear, you’ll see no stronger bull than yours truly. I am slowly loading up on stocks right now. Not all in by far, but enough to like what I see these days. Still mostly on safety though.
It’s true that the upper chart is velocity (per Yao and SFHawkguy.) Therefore, prices are still dropping… year-over-year.
However, the lower two charts are absolute price. Those show a small increase. So there has ALSO been some price increase, when measured month-over-month.
Pretty small increase though. Probably too soon to declare “Mission Accomplished”, ya know…
OK. I’ll jump in with my own preposterous prediction and opinion. The alt-A wave hasn’t hit and unemployment is over 10%. This is just some knife catchers getting in while they’re portfolios are temporarily up plus the standard bounce, and then the race to 1999 prices is back on and those that are “calling the bottom” will go back to figuring out how you can default on your loan in q4.
There. I said it.
john — definitely not the case. Was a bull before this housing boom and when rent appeared to correlate to price better. As San FronziScheme said — if fundamentals on housing return to something favorable, I’d be stupid not to try to make money from it.
I dislike permabulls (like NAR) as much as permabears.
Did SF housing have a peak in 91 and a trough in 96 like LA?
jimbob,
SS’s excellent charts go back to 1987. Look at the first one top of the page and you’ll see a series of dips/bounces going from late 1990 til mid-1996. It was mostly negative. I recall LA had a much bigger dip (~20% dip overall).
Keep in mind defense was scaling down right at that time and that impacted CA big time. Good thing tech came right on time to save the day.
Lurker here: I am simply stopping by to say thank you to tipster and the rest of the logical thinkers on SS. Laymen like me appreciate your insight rather than the realtor-speak found elsewhere.
It is thoroughly disappointing to me to see the bottom feeders posting here. Does it not occur to you that your 3% commissions are a 30 year commitment to those of us who don’t return our properties to the bank? You have no evidence to support that a decision to buy today is a sound economic decision. But of course (and I quote),” prices have never been so low, coupled with low interest rates,” right?
I wasn;t talking about CR (Calculated risk? – never heard of that until today). I was talking about this site only. Certainly no one claimed here in winter that the declines were being overstated in winter due to seasonality.
REpornAddict:
This simply isn’t true. I noted seasonal factors many times over the winter. In fact, I said it so many times that “Stu” wrote this when May numbers came out:
OK ex SF-er, your May numbers are out. What’s your take? I’ve been telling all my friends that some guy on the internet said we had to wait until the May numbers came out.
Posted by: Stu at June 18, 2009 12:23 PM
Here is one of the many times I wrote about seasonality in the winter:
I wrote:
=======
month to month data can be highly volatile. Look at the chart above and you’ll see several instances of quick price jumps… (happened in early 07 and late 05 as example). this is why few of us use M-O-M data. instead we use Y-O-Y data and moving averages.
Data is also not the greatest due to the small number of sales.
that said: prices do tend to rise due to seasonal factors (again look at the above chart). we’d expect prices to rise now, for whatever reason.
I wouldn’t make too much of the price data on one month. Instead, I’d see how this Jan through May compares with last Jan through May. (we’ll have May data in July).
Posted by: ex SF-er at March 19, 2009 10:55 AM
It is thoroughly disappointing to me to see the bottom feeders posting here. Does it not occur to you that your 3% commissions are a 30 year commitment to those of us who don’t return our properties to the bank?
I don’t know that a single realtor said a single bullish word in this thread. But yeah, Tipster is awesome.
(I’ll reprint the last sentence of my post from MARCH 2009, and bold it):
that said: prices do tend to rise due to seasonal factors (again look at the above chart). we’d expect prices to rise now, for whatever reason.
in other words: Many of us who analyze markets (e.g. me) expected that price drops would slow and that perhaps prices would go up over the summer selling season.
what does this mean: essentially nothing. We’re seeing a pretty typical price rebound over the summer months due to seasonal factors. It is good news that the collapse of housing has slowed, unfortunately 2 MOM data points are not enough for optimists to proclaim victory.
(what did you all expect? that we’d see 30% price drops year after year?!!!!!)
I’ll stand by what I’ve said for nearly 3 years now: people should consider buying RE when we have 12 consecutive months of YOY increases. this way you have less risk of buying into a false recovery/dead cat bounce.
waiting that long is highly unlikely to cause you to be priced out forever. RE turnarounds are very slow.
there is one small caveat: if you start to see rampant inflation then it might be the time to abandon the dollar and get into hard assets.
what fascinates me about real estate in SF and in certain parts of the penisula is how low overall inventory is and how little it takes to shift buyer psychology one way or another.
in palo alto or central menlo park, the average house changes hands once every 32 years. in Noe, there are only a handful of 4+/3+ homes for sale right now. no dount there is a ton of shadow inventory, but I also know there are many buyers on the sidelines.
the smart play is likely to keep waiting, but I expect to see buyers wading back in this fall. it just takes too long to find acceptable property if your search is confined to a neighborhood or even a street. a few more pieces of good news, and fall ’09 will be better than ’08 (not hard) and possibly better than ’07 in volume. at what price – who knows. the buyer/seller standoff has lasted longer than I thought possible.
Point taken ex-SFer, what I should have said was
Certainly no one except SFer claimed here in winter that the declines were being overstated in winter due to seasonality.
I was actually referring to explicit quoting of the seasonally adjusted numbers, rather than mentioning it as a factor, but as I say, point taken!
By the way, I have thought about your 12 consecutitive YOY thing a few times – it’s OK but I think could in fact miss the bottom by more than you think – maybe.
For example, using the overall index, it could rise by 1% a month from now and it would take 18 months before you consider buying – although it would be clear things were better long before then.
But, as you say, RE turnarounds tend to be slower than this, just a little reductio ad absurdam..
And I’d probably argue that if things flatline for a year or so you might as well get in then rather than waiting another 12 months for those YOY increases – especially if rates stay historically low.
I suspect things will drift up and down until December, well within any margin of error.
Posted by: tipster at June 30, 2009 10:33 AM
How’d I do with that prediction so far?
So far pretty poorly I think.
Things went up this month after you posted in a month where we had a rise, so no drifting up and down as yet since you predicted.
If the index had gone down this month, then I think you would have done better.
And define your margin of error – I don’t think the top tier gain of 3.8% this month is ‘well within any margin of error’ of ‘drifting’…
REpornaddict:
it is true that if one waits for 12 consecutive months of YOY gains that one will most likely miss the “bottom”. However, doing so will also help you to miss any “dead cat bounce” and keep you from being a knife-catcher. I feel my plan is conservative on both sides (up and downside).
That said, I doubt we’ll see a rapid ramp-up into RE as we recover barring significant govt manipulation of the markets, or rampant inflation. those of course are 2 very big caveats. The govt has shown itself willing and able and desiring to blow another bubble. Deflation reigns supreme now, but at some point (possibly years from now) inflationary pressures will mount. FWIW: monetary inflation can both increase nominal house prices and also decrease nominal house prices depending on price inflation of the various assets/commodities.
there are clearly permabears and permabulls. I believe I am neither, although I’ve been a massive bear in RE for most of the 2.5 years I’ve posted here, and a Stock bear since end 2007/early 2008. (I was a massive RE bull from 1999 to 2005 in SD, and massive stock bull from 2003 to 2007). But I don’t have any interest in being a permabear. Permabears get their butts handed to them in secular (and sometimes cyclic) bull markets. Permabulls get slaughtered in bear markets.
Thus, it behooves me to analyze the data as best I can and to look for a safe entry point (long and short). Problem is that there is currently too much govt intervention and the rules change mid-step, not to mention egregious rules/behavior by the big boys that make “investing” a losing proposition. Thus, I’ve taken much of my cash off the table these last few months, although I’ve dabbled a wee bit here and there.
Currently, I believe we are in a very strong bear market rally. There are many reasons why this had (and maybe still has) legs. In fact, we may have official end of our current recession in 2H2009 (I’ve stated earlier this year that an end of the recession later this year wouldn’t surprise me).
Unfortunately, the underlying structural problems with our economy remain and the end of recession does not mean recovery. On the contrary, there is a strong case to be made that we’ll have a jobless recovery plus/minus a double dip recession .
still too early to tell if we are going to have a “W” a “U” or an “L” shaped recession. as I’ve said many times, a “V” shaped recession was never in the cards for us. credit crises never lead to “V” shaped downturns.
Good luck to you all!
For the archives, current foreclosures (NODs, NOTS, bank-owned) in Ess Eff stand at 1428 (and rising).
tipster —
That blip up looks suspiciously like the amount of the first time home buyer credit.
You are either a very, very bad person or quite insightful. Can you make a case for this wicked hypothesis?
isn’t there a long queue of 2004-06 buyers who took non-conventional “creative” loans that will readjust soon?
and isn’t the unemployment rate still rising?
sounds like a recipe…
“bottom here.”
He who picks bottom
winds up with stinky fingers.
Socketsite rationalization. Early spring loss = cagaclysm. Late spring gain = seasonal bounce. Mid summer gain = seasonal bounce. When a late summer/early fall gain occurs? You guessed it. That gonna be a seasonal bounce. But when/if a Thanksgiving and on to winter lull happens? That’s gonna = cataclysm.
Sorry. Some of us are paying attention. You can’t have it both ways.
“isn’t there a long queue of 2004-06 buyers who took non-conventional “creative” loans that will readjust soon?”
For the archives; My 2004 is at 3.6% now. And most of the ’04 vintage have already reset, plus they all partially reset annually so the final one wouldn’t be large. Mine would have been non existant because the full is so low now.
Option ARMS: Good News, Bad News
An interesting NYT article: http://www.nytimes.com/2009/07/29/business/economy/29housing.html
“We’ve found the bottom,” said Mark Fleming,…
Brad Hunter, …said the new home numbers appeared to illustrate less a return of buyers …more a resurgence of investors and speculators
When the numbers were adjusted for seasonal factors, …the slight gain disappeared
diemos,
Yeah, many if not most of the Option ARM “idiots” wouldn’t have qualified for a normal loan, and some didn’t actually qualify for the Negative ARM they managed to get in the first place (thanks to “stated income” and $0 down). The sooner they get cropped out the better.
Add this to the whole point behind option ARMs: assumption that a resale/refi at a higher price will pay off P+I before anyone gets hurt, and you’ll understand why many free-loading specuvestors are walking off this train wreck before any recast/reset.
Of course it’s not all free-loading specuvestors. Some people actually used Option-ARM to pay more than the regular amortized amount. He is living in Michigan and his first name is Andy…
I think all of this is a good thing. The market corrects faster, more efficiently, and we will know sooner if we have a bottom.
the new home numbers appeared to illustrate less a return of buyers …more a resurgence of investors and speculators
Good. Knife catchers are a part of any correction. Cautionary tales on what will happen to them will help crop out the foolish specuvestors still standing.
“Can you make a case for this wicked hypothesis?”
Yes. There is no such thing as a housing upturn in an economy with 10% unemployment. Foreclosure moratoria, fake low interest rates, guaranteed FHA 3.5% down loans (with the down being paid by housing rebates), all manner of rebates, and people trapped in their homes etc. can cause a slight upturn, but not a sustainable one. An economy with 10% unemployment cannot.
Faking out the masses may cause some sideliners to jump in, thinking they hit the bottom, so it’s possible that blips up will continue. But that is not going to be sustainable either: you run out of those people.
Call me a “Pessimist” but if any of you watched KRON4 at 4PM ish or CNBC (channel 58 on comcast) around same time, they were both discussing this report and the index.
And a majority of the Analysts said the same thing, which is
“1 month stats do not indicate or imply a ‘TREND’…
Sorry folks. We are still not out of the woods yet.
Socketsite rationalization. Early spring loss = cagaclysm. Late spring gain = seasonal bounce. Mid summer gain = seasonal bounce. When a late summer/early fall gain occurs? You guessed it. That gonna be a seasonal bounce. But when/if a Thanksgiving and on to winter lull happens? That’s gonna = cataclysm. Sorry. Some of us are paying attention. You can’t have it both ways.
Then my dear anonn you have only to listen to what I say, since I haven’t and won’t do that.
Your gripe highlights why one shouldn’t use only the seasonally adjusted OR only the non-seasonally adjusted numbers. it also highlights why MOM numbers shouldn’t be used.
Instead, you should use BOTH the seasonal AND non-seasonally adjusted numbers, and compare YOY as opposed to MOM.
using both SA and NSA numbers and comparing YOY instead of MOM will rid us of the problem that you’re so upset about (people claiming that the winter downturn is a ‘cataclysm’ and the summer upturn is seasonal).
on a side note, the thing that’s irking you is happening right now with people using 2 MOM gains as a sign of stabilization/turnaround.
For the record, I wasn’t upset about anything there except for my own typos. It’s just sort of funny.
I’m still getting a laugh how – after months and months of Case Shiller posts, when every bull went on and on about how CS does not measure Ess Eff – there’s not a single post on this thread about how a minor blip up in the entire MSA doesn’t apply to Ess Eff specifically.
For the record, if you go back and look at my post from two months ago, you’ll see that my prediction was not too bad – even somewhat caught the “turn” in the market:
“That said, I also expect some moderation of decline in the next few months, and perhaps an increase in the middle tier (where FHA and GSE support is going to be most effective). Case Shiller has exhibited seasonality, and the slowing of declines for March fits perfectly with the historic pattern” (Posted by: LMRiM at May 26, 2009 11:58 AM)
But of course, according to the bulls, no one mentioned seasonality in Case Shiller, which is suddenly indicative of Ess Eff and not the overall MSA.
For those who understand spanish, a Caga-clysm is something that should contained to the secrecy of your own home. SS editor, no need to start a thread on that one…
Just for laughs, the CAGA is also the Certified Appraisers Guild of America. Funny how some acronyms become appropriate!
We also need to remember that the CSI numbers are a 3-month moving average. So the May numbers take into account the March and April sales data as well. These months represent the time period when we had record low mortgage rates of well under 5%, rapidly increasing use of 3.5% down FHA loans (more than 1/4 of all Bay Area purchases), federal and state homebuyer tax credits, and fewer foreclosures because we were in the middle of a number of federal and state moratoria.
I’ve said here before that all that goosing of the market will certainly have an impact on sales and prices, noting the caveat that when the goosing ends, as it must — and certain elements are already ended — the effect will be reversed. I suspect that if we had data on the $1 million-plus market where these interventions are less applicable, the numbers would show continuing rapid declines. You need look no further than inventory and sales numbers to see that. The freeze is amplified as you move up the price chain from there. (see from CR: http://www.chicagotribune.com/business/chi-bargain-mansions-27-jul27,0,3574823.story)
I admit that even with all these trillions of dollars of goosing, I expected CSI numbers to continue their fall, albeit more slowly. The bottom tier has fallen so far that it simply must slow and stop at some point in the not-too-distant future. But the new numbers are the result of these interventions and seasonality. I may be wrong — we’ll know by December and January when the October/November numbers come out. Ex SF-er is exactly right about looking ta the SA numbers (I suggest SS revise its charts to do so).
things are going great and only getting better…future’s so bright i gotta wear shades.
I think this is a good time to pause and look backwards.
Suppose that we are at or near the bottom for the SF MSA. In that case, we can do a trough-to-trough comparison, as Jan 1987 was also close to a bottom (the actual bottom there was in late ’86). Combining the monthly C-S data with monthly CPI and mortgage data, we can asses the performance of our asset class — an “average” house in the SF MSA, purchased for 160K in Jan 1987 and sold for 408K in May 2009.
The nominal CAGR is 4.3%, but the real CAGR is 1.3%. For the cash-on-cash return, let’s assume the owner got a 20% down 30 year mortgage, but paid the going rate each month (i.e. continuous costless re-financing each month, but without extending the repayment deadline). Also grant the Prop 13 benefits, and assume that the owner only paid 2/3 of the mortgage interest costs due to the deduction. Assume 1% of the C-S schiller value was required for maintenance. In this case, after 22.4 years, the owner will sell the house and after retiring the outstanding loan amount, pocket $346542.62 (May 2009 dollars) — or $180,193.87 (Jan 1987 dollars). However, during that time, the owner also spent $32,000 1987-dollars for a downpayment, and made 220,671.95 1987-dollars worth of monthly PITI/maintenance payments. So the cash-on-cash trough-to-trough return is negative $72,478.08 1987-dollars, or -139,387.35 May-2009 dollars.
But this wasn’t a wasted purchase. Generally, you should expect to lose money on the property once you take all costs into account — and I ignored all transaction costs. But you get to live in the house. In other words, the loss is what you pay in rent. So this owner was able to pay on average only $269.43 1987-dollars a month to live in the house. Sounds like a good deal, right? Well… first the owner had to commit to 32K. Then, for years the owner had to pay first $1K a month, and subsequently those payments shrank to $650 or so, due to the refinancings and the lower rates. All figures in 1987 dollars. It was only after doing this for 22 years and getting the final sales proceeds did it turn out that the net costs were so low. So how do you calculate the cost of the 22 year capital commitment?
You can view a rent vs. buy calculation as the decision to buy equity claims or debt claims. In other words, two people have the same downpayment and the same monthly payment stream. The owner — or rather the borrower, uses the downpayment and payment stream to secure a loan to buy a house. The renter — or the lender — invests the downpayment in mortgage bonds — loaning the money to the owner. Whenever the renter pays a lower monthly rent payment than the owner, the renter invests the difference in mortgage bonds. Whenever the renter pays a greater payment than the owner, the renter sells some of his bonds to cover the difference. Now, you may object that the owner does not need to take out a loan. But, even a cash buyer has the choice of buying a house or buying a ton of mortgage bonds, and paying rent from some of the coupon proceeds, re-investing the remainder. Therefore the cost of capital for housing equity is the mortgage bond rate.
If you run this calculation on the historical data, the breakeven rent for a 160K house in the SF MSA was about 600/month. That was 1987, but I’m assuming that whatever the 1987 rent was, that it would grow with incomes and determine the 2009 rent as well. Below that, the renter made money, and above that amount, the owner made money. In 1987, median prices were about 160K, and median 2 BR rents were about 700. So, it was cheaper to own, but the savings were 100 1987-dollars month.
That is for a 22-year period. because of the high up-front costs, it takes time for the owner to start turning a profit. Eventually, inflation eats at away at the fixed payments and wage inflation pushes up rents, so the owner will tend to come out ahead. However, the time required could be very long. Consider a starting rent of 1000/month — which would get fantastic house in 1987 — and this would grow with incomes, reaching 2700/month in 2009 — a rent that very few 408K houses in the SF MSA could command today. Even with this rich rent, it wasn’t until 1999 that the owner was reliably ahead (before that, during peaks, the owner was ahead, and during troughs, they fell behind). So, you are looking at minimum hold times of 15 years or so for “normal” rents. Note that the median hold times in SF is about 10 years.
These months represent the time period when we had record low mortgage rates of well under 5%, rapidly increasing use of 3.5% down FHA loans (more than 1/4 of all Bay Area purchases), federal and state homebuyer tax credits, and fewer foreclosures because we were in the middle of a number of federal and state moratoria.
You can’t be serious. March was pretty much an economic nadir by anyone’s account. Its closings display February sales activity. April was an improvement, certainly, but the stock market was in the toilet in March and not that many properties got into contract in March either. Using those two months as part of a rationalization for why the quarter would skew toward an uptick is pretty doggone funny.
Sorry, anonn, but you forget that CSI is based on not only SF but also its neighboring counties — despite your hammering on this point every other month. And the 3-month average includes March, April, and May, not just the first two. Sales activity in SF has been, and continues to be, very slow — because SF properties tend more toward the higher end price range, far above even the top tier line in CSI. But sales activity in SF’s neighbors (except for Marin) picked up steam considerably this Spring as lower-end homes were gobbled up due to the very factors I described. That is what CSI captures. Somebody buying a $300,000 home with a 3.5% down FHA loan, and getting that small down payment back as a tax credit, couldn’t care less where the stock market is.
The jumbo market segment — much but not all of SF — has not benefited from all the market juicing like the low end has. Thus, the high end continues to plummet while the decline at the low end has slowed — at least until the artificial respiration is turned off.
So why is it the high tier that has done so well this month (up 3.8%) while the bottom tier actually contines to fall..it was the same picture last month as well.
Yes, I know the high tier cut off is very low by SF standard, but it still doesn’t paint a consistent picture of the low end doing well while the high end ‘continues to plummet’ – in fact quite the opposite.
does anyone know when the Q2 numbers for the C-S/first republic prestige index are due?
prestige index: http://www.firstrepublic.com/lend/residential/prestigeindex/sanfrancisco.html
for all of your true top-tier needs
Fair question, REPornaddict. But all three CSI tiers are “low” by SF standards and far below what I’m referring to as the higher end where prices are falling most rapidly. The MOM changes for all 3 tiers are so small and within the margin of error as to just be noise at this point. The top tier saw a little bump in May 2008 too, but that certainly was not the bottom. The latest number is 20% below that figure! Sales at all three tier points are benefiting from the market-goosing factors at issue. Let’s see how the trend develops — or continues — as we move out of these peak seasonal sales months. Too bad we can’t see how the top CSI decile is faring.
yup, I do accept the point about the tiers, definitly.
But if the top decile really is hurting as much as you suggest, the next couple of deciles down must have done amazingly well over the past 3 months to give a result like this.
Or, as you say, it could be some noise – guess it will become a little clearer over the next couple of months.
but you forget that CSI is based on not only SF but also its neighboring counties — despite your hammering on this point every other month
Yeah. You’re right. This chart never showed SF per se and the divergence is more stark than ever.
Back in the day when the upper tier limit was hovering around the SF median (>850K in 2007) one could say that you could correlate the upper tier with SF, even average to primo SF. That was a decent indicator. It had its flaws, but that was a good enough proxy.
It appears volumes have changed that and the upper tier is now significantly lower than SF median. That’s probably due to much bigger volume in lower priced segments (duh).
CS’s tiers might need some refining, like quintiles, sextiles? Or maybe, just maybe simply taking SF as a whole entity? After all, it’s all number crunching. I am not sure about statistical accuracy though.
SanFronzi, you’ve nailed the issue.
Also, for those more well-versed in stats than I, can anyone explain how one reconciles the ever-declining breakpoint for the CSI top tier? Does S&P factor this in? For example, the May ’08 top tier breakpoint was far higher than the May ’09 point — so when one graphs the top tier changes over time, is that still a meaningful graph or is it all apples and oranges due to the severe decline in the dividing lines?
In 1987, median prices were about 160K, and median 2 BR rents were about 700. So, it was cheaper to own, but the savings were 100 1987-dollars month.
How can this be? Even with a 20% down payment, interest alone on $128k in 1987 was much more than $700. Mortage rates were over 10%, so interest payments alone would have been over $1000/mo. Add in property taxes of $160/mo and even considering tax deductions, the ownership cost is higher.
Who knows!
At least the overall result looked consistent with each of the tiered results last month.
Very often (and last month was a prime example) this isnl;t the case.
Tiered results were -1.8, -.7, +.2 – but overall was +.6.
Never got a satisfactory answer to my question about this last mont, at least one that I could understand! Certainly didn’t pass my smell test!
I’ve been keeping an eye on the IAS360 HPI as well for deeper info. IAS digs down to the granular neighborhood level to give you deeper/more accurate data. It comes out once a month and only has a one month lag.
CA,
I had looked at IAS not long ago.
They do have county-by-county data available free to the public. It is noW pointing to April-to-May differences:
http://www.iasreo.com/ias360_update.html
SF county shows as -0.1%. No idea what the mix did to these numbers though.
NVJ, you are taking that sentence out of context. It was cheaper to own over the 22 year holding period, and the $100 represents the difference between 2BR fair market rents in 1987 and the break-even rent for this property. I should have been more clear.
Again, to compare apples-to-apples, both sides need the same downpayment and same housing payment stream. I take the owner’s downpayment and payment stream for both. This is more than what the renter needs in the beginning and less than what they need later on.
The renter buys mortgage bonds with the downpayment. When the monthly owner’s cost is greater than rent, the renter adds to his bond hoard. Whenever the cost of owning is less than renting, the renter sells out of the hoard. The renter’s bond hoard grows with the mortgage rate, and the owner’s equity-hoard grows with case-schiller and repayment. Rents grow with incomes, and I used BEA per-capita data as a proxy for that. For example, you multiple the 1987 rent by 2.7 to get the 2009 rent, because that is how much per-capita incomes increased. So it all comes down to whatever that property could rent for in 1987. This is what I mean when I say the breakeven rent was 600 in 1987.
Note that both put more money into housing than they receive by selling their hoards — housing is primarily a consumption expenditure — but because they put the same amount of money into it, you can compare the financial winner by looking at the sales proceeds of each. If the house could be rented for 600 in 1987, it would be break-even. Since rents for 2 bedrooms were about 700 in 1987, I infer that there is a $100 gap in the monthly rent needed to break-even. In other words, the renter “thew away” $100 a month in 1987, and that amount grew to $266/month in 2009, due to a combination of inflation and real wage growth.