Earlier this week a sale pair for a Noe Valley condo was submitted by a reader for consideration as an “apple.” And while the pair passed our basic test (no major changes to the property between sales), its latest sale on 12/17/08 fell down on another (recency).
Then again, perhaps we’re wrong to believe the market has changed much since the fourth quarter of 2008. (Keep in mind that a mid-December close would suggest a contract that was written in either October or November.)
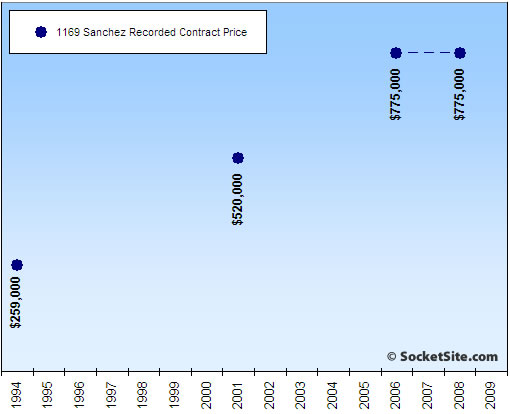
We have to admit it’s tempting to look at the sales history for 1169 Sanchez, see a sale on 4/11/06 for $775,000 and then again on 12/17/08 for $775,000 and declare the market flat. But that wouldn’t be a very accurate depiction of what’s actually going on.
And while not perfect, adding a median price per square foot trend line for condo sales in 94114 to the chart of contract prices for 1169 Sanchez should help make the point(s).
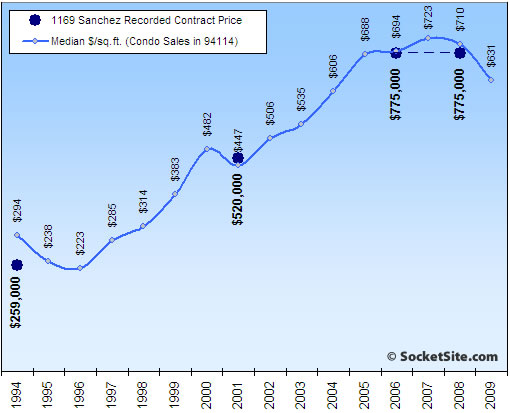
Perhaps that market isn’t so “flat” after all (and has actually been trending down since 2007). And looking to a December 2008 apple to understand the May 2009 market might not make too much sense.
That’s a nifty little graph. I would not have thought that a property would “fit the line” so well.
as we all know, the market is a different monster than it was 6 months ago. It doesn’t make me ignore this apple… the apple seems in fact to validate what many people have been saying- that Noe held its value longer than other local SF micromarkets.
It would be “nice” if this property sold again in the next few months to see if it validates the idea that Noe really got hit starting last fall.
A loooooong way to go still……….
Elegant.
Very pertinent graph on the Shanchez property pricing. Kudos to the ever-excellent Socket Site editor.
More elements from this graph:
– 94114 condos more than tripled from 97 to 07
– There were 2 big ramp-ups: 1 – dot-com and 2 – RE frenzy. How much is population shift? How much is pure bubble? See you in 4 years.
– We are in May 2009 and things are very different than late 2008.
Lemmings in the middle of the cliff fall can say “We’ll be OK, we were touching ground like what, just 2 seconds ago? I’ll come back soon enough, no worries.” But you can’t cheat the laws of physics forever.
Gravity’s a b!tch.
My point was, and always was that lower priced tic’s and condos in prime SF are down roughly 10%. Most SS apples are for higher priced properties and the 20% +/- drops are ignoring a significant set of SF RE. And, the median $/sq ft you graphed illustrate what I have been saying to a T! $710 for ’08 and $639 for ’09.
I don’t have the energy and inclination to chase after apples, so those were the ones that came my way. However, if SS wants to reflect reality, someone needs to seed (ha ha) a broader range of apples that better reflect the reality of the city. But given the bearish bulk of its readers, I don’t expect this to mushroom from the reader base. But thanks for putting the graphs together.
This is an elaborate way of saying that calling one property “the market,” whether apples to apples or otherwise, is not telling the whole story. Obviously I will go along with that. But I’m betting if you revisit this chart in a month or so, 3/21 thru today for Noe will show a tick upward.
That is correct, SS has a very large bearish reader base, so if you just read SS and nothing else, you would think that the world is coming to an end.
The reality is market (both RE and stock) are up so much in the last 3-6 month.
The listing on our street sold over 1 weekend with above asking price. A property of 1400 sq feet asking $799K, sold for $820K. Then, we purchased ours for $775K in 2004 for 2700 sq feet.
A friend is currently looking, and told me that he is shocked to realize that the market has not come down at all for the segment that he is looking.
Nice work! Illustrates you really need to look at a lot of different things since this market is so opaque. Case Shiller repeat sales data; medians; $/sf; listing volume; sales volume; apples; seasonality. I’m sure there are other less direct but still important factors such as income, employment, interest rates. Look at any one and you’re likely distorting the big picture. As a whole, these indicators plainly show declines. Does any one of them indicate anything else? I guess one will always be able to find an apple or two that fetched a decent price. And I would bet money that medians and $/sf will be stronger in May than, say, March due to seasonal factors (or maybe something else — we’ll know over the longer term).
SFFronzi, your lemming quote was quite funny (and apt)!
How exactly does this sale fit the plot, other than just skewing some numbers to work.
The place is 970 square feet. So when the market showed 294 it sold for 267, when the market showed 447 it sold for 536, when the market showed 694 it sold for 799, and finally when the market showed 710 it sold for 799. Chart that.
“How exactly does this sale fit the plot”
You have unrealistic expectations for how closely a single data point is going to track an aggregate number. If I showed that plot to any of my scientist colleagues they would call that excellent agreement.
First I doubt this is a “pure apple” through all 4 sales. I would not be surprised if we found that there had been some type of remodel between the 1994 and the 2001 sale. Even if there aren’t permits on file for a new kitchen cabinets/counters, upgrades in the bath, etc.
When you compare its price to the median you see the following pattern:
1994 sold at a 10% discount to the median
2001 sold at a 20% premium to the median
2006 sold at a 15% premium to the median
2008 sold at a 10% premium to the median
Based on just that history I would guess that something happened between 1994 and 2001 to make this go from a below average unit to an above average unit and that whatever the change was that its appeal is slowly fading over time. Hence my theory that there was some type of remodel/upgrade to interior before the 2001 sale that is aging and declining in value added with each sale.
Between 1994 and 2001 the neighborhood of Noe Valley gentrified enormously.
Well well well…looking just at this condo and the median $/sqft in the whole 94114 chart, it turns out that it’s not really so very micro after all, bro.
What would be interesting to see is the correlation between the condo median $/sqft charts for 94114, San Francisco and the SF MSA. Any takers?
Has it been degentrifying since then? That might explain why it jumped from a ~10% discount to a ~20% premium but does nothing to explain the decline down to ~10% premium since 2001.
So your explanation fits half of the equation. Do you have a theory for the other half?
Also wouldn’t a lot of that gentrifcation be included in the median? Now obvioulsy the 94114 zip code includes more then Noe, but I would expect that one property wouldn’t be so swingy compared to the median since median should be capturing some of the gentrification effect of the neighborhood.
I wasn’t using the same prism. I was looking more at cost, than premium to median, Rillion. From 1994 to 2001 the price more than doubled. Then 2001 to 2006 saw another 50% increase. So I guess I’m calling 100% versus 50 % “enormous,” and due in no small part to a neighborhood shift. I do think the neighborhood continued to gentrify with tech money from 2001 on, but not to the same extent. Your mileage may vary.
I’m 95% confident it had a remodel sometime between 94-01. But the reason it sold consistently above median value (as sparky noted) is because it’s small- only 970 sq ft. Median sales values distort smaller property values down and price per square foot distort them up. Beware- numbers can be deceptive!
How many condo sales are there in 94114 each month? In 12/2008, say?
when did this bldg condo convert? I think it sold as a tic in the 90’s, which is why it was below median then. I’m guessing it was remodelled when it was condo converted, and then it started maximizing the dollar per sq ft value.
Yes, kudos to the editor for digging deeper – and for inspiring such funny comments. I like this one best:
The reality is market (both RE and stock) are up so much in the last 3-6 month.
I know when 45yo hipster (and I hope that name is intentionally ironic) chastizes the bears he is talking his book, but what is your motivation, esther?
When comparing to an aggregate number, the whole “apples-to-apples” idea doesn’t have the same meaning.
To me, this chart says that this property is somehow super-typical. If it was typical that properties in 94114 had a remodel or converted tic-> condo or had some other value-add work, then it would make sense that a property that had those would track the median…
“but what is your motivation, esther?”
trying to convince herself that she’s doing the right thing. From what I’ve seen, ester posting on how well the market is doing is a clear sell sign.
If it was typical that properties in 94114 had a remodel or converted tic-> condo or had some other value-add work, then it would make sense that a property that had those would track the median…
El-D,
I think that this is exactly what people are thinking. Specifically, many of the Noe homes have been remodeled or been added on over the last 15 years. noe of 1990 was a very different place than noe of 2000. Noe circa 1990 was a working class and middle class nabe. Noe circa 2006-8 is suddenly considered “prime”. thus, many of the homes that have sold in that time range have been remodeled, added to, renovated, converted, etc.
it’s one reason why people hypothesize that the 1994 property was unremodeled (hence way below the zip code median) and then in 2001 it had been remodeled (due the higher than the median sales price.) And then it was lower again in 2006 and today due to the remodel being “old”.
that said, all that is all pure conjecture.
I think the more intriguing part of the post is that this apple is consistent with BOTH bullish and Bearish views. consistent with bearish view as it fits right on the median price/sq ft curve (that is trending down). consistent with the bullish view as that particular owner could say they didn’t lose anything on the property!
“Noe of 1990 was a very different place than noe of 2000.” Gentrification was well under way for several years before 1990. Think 1970’s. The funny thing is with all the million dollar plus homes in Noe Valley, it still looks like it’s gentrifying. There is still an abundance of real dogs.
The funny thing is with all the million dollar plus homes in Noe Valley, it still looks like it’s gentrifying
Yes, notice how much Upper Noe has changed over just the last five years in particular. That old pizza place at 30th and Church is not La Ciccia, Hungry Joe’s is now Toast, and India Oven, Deep Sushi, Incanto and Henry’s are all new. Upper Noe Rec just got fixed up nicely, too.
I am not saying that these are all “good” things necessarily , but they are definite signs of gentrification.
That area used to be called outer Noe or Nowhere Valley, not upper Noe. But you are right, that area has seen an improvement in restaurants and a decrease in available parking spots.
Seems like SS is trying very hard to argue a point, but has anyone here really asserted that the Noe condo market remained unchanged from 2006 to late 2008, rather than in fact having gone up and gone down?
The important question is where the market will be headed after May 2009. No help there from this graph. We all will need to stay tuned.
“would not be surprised if we found that there had been some type of remodel between the 1994 and the 2001 sale”
Not surprising nor does it undermine the validity of this curve fitting analysis. During that same time period millions were spent on remodels in Noe, and that is part of the reason behind the 3X increase from 1997 to 2007.
I thought the whole point of using apples was that median sales data is unreliable (especially at the zipcode level).
But isn’t this just using median sales data to explain/extrapolate apples??
We have another lemming jumping from the 20th floor, as he falls, he counts off the floors…..19,18,17…..so far, so good.
steve wrote:
> I know when 45yo hipster (and I hope that name
> is intentionally ironic) chastises the bears he is
> talking his book, but what is your motivation, ester?
The 45yo hipster and ester have both posted that they own investment real estate in SF… The only rental property my family owns in SF is the home in Balboa Terrace that my Grandfather bought in the 30’s (I rent a place in Presidio Heights).
I personally own rental property in Sacramento, but I have no problems talking about how all Sacramento real estate values are tanking (since I bought planning to renovate the buildings and hold for cash flow)…
P.S. I’m 45, but not a “hipster” (I’ll be 46 this summer)…