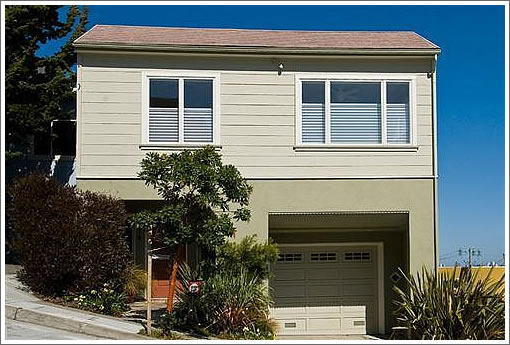
Purchased for $1,413,000 in January of 2008, the four-bedroom 714 Duncan is back on the market in Noe Valley and asking $1,295,000. A transfer forces the sale.
There’s little doubt the quick turn will result in a loss as even with “typical San Francisco appreciation” transaction costs wouldn’t be covered. But that doesn’t mean this data point will be flawed. In fact, this sale will provide some rather clean commentary on changing neighborhood values over just the past year. And that’s why we like, and offer, our apples.
∙ Listing: 714 Duncan (4/2) 2,050 sqft – $1,295,000 [MLS]
∙ Expectation Setting: San Francisco Appreciation [SocketSite]
Down 8%, looks priced at the market.
Will predict $1,250,000 because buyers are demanding and getting discounts.
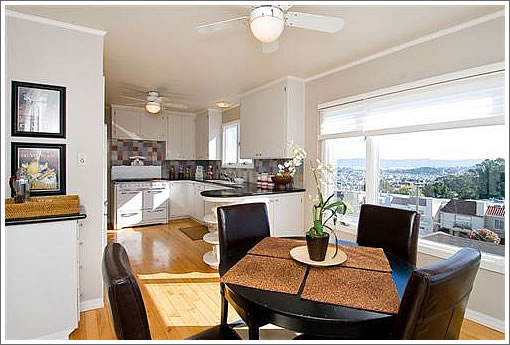
That is one cute kitchen.
When all’s said and done, this homeowner can say they lived in the real SF for roughly $20K/month.
Unbelievable.
The 2008 Property Tax was $3899? The 2008 Sale is flagged as an “anomalous transaction” by Zillow.
No other sales data is available prior to the 2008 sale. Can anyone fill in the details?
My husband I looked at this place back when it was on the market in 2007. The view is beautiful and they did a great job with the updates.
However, being a 1950s era home, the layout is somewhat cramped and the rooms all seemed somewhat narrow. I recall the living room in particular being quite small. And the only access to the lovely backyard is through the downstairs bedroom which we didn’t find practical in terms of privacy.
But it’s still very pretty.
A transfer forces the sale.
I’m amazed that a company would transfer someone out of the Innovation Mecca 😉
I hope the company picks up losses on sales + real estate commissions (many do for even mid-level people – or at least they used to). Otherwise, this will have been a very expensive 13 months or so.
The 2008 Property Tax was $3899?
It takes a while, dub dub, for the recent valuation to make it through on a regular tax bill (I think it takes a full tax year cycle starting on the June 30 following your purchase). But you can follow current tax by looking for the “Supplemental Tax” bill on the pull down menu on the assessor’s site (http://www.sfgov.org/site/treasurer_index.asp?id=98446).
Current taxes seem to be assessed on the full purchase price of $1.413M listed by the editor, but you need to look at the supplemental bill to see that.
When this sells for asking, will you shut up about the “prices *must* be down more than 5-10%”?
I know you and fluj love to go at it, but I am sick of hearing it, at least until we have enough data to support the conclusion.
aaaah. That’s consistent with no prior sale data on the aggregating site (zillow). I’ve never used the sfgov site directly, I use zillow and propertyshark to look around the bay area and elsewhere. Thanks LMRiM!
NVJ,
That sounds fine and dandy if you assume the market peak was Jan 2008. Add the -8% to the losses from peak to Jan 2008 and you’ll have a better estimate.
“Add the -8% to the losses from peak to Jan 2008 and you’ll have a better estimate.”
What’s your methodology there?
Lmrim- see the typical SF appreciation link above. That was the one I referred to a couple weeks ago. It sez, SF appreciation averaged 4.2% basically since pat WWII (national av 2.3%). 60 years of 4.2% data av, so I don’t think the post y2000 rise will change that base too much. Care to interpolate (as opposed to extrapolate)?
When this sells it looks like it will be a good apple. The place may have a quirk or two but overall it is fairly typical of the Noe Valley housing stock. In other words, it is not a dream house but it is a solid desirable SFR with some pluses and some minuses.
45yo hispter –
I think you need much more granularity than simply “post-WWII” when talking about average returns. I’ve posited that the “hinge point” for outsize nominal returns should be sought in the late 1970s/early 1980s for 2 reasons: 1) introduction of prop 13 in 1979, and 2) beginning of the secular credit inflation/price disinflation cycle that began in the very early 1980s.
I’ve always found that one of the keys to succesful trend investing (which is what you are implicitly arguing – a concept of “mean reverting” SF nominal price trends) requires recognizing inflection points when the trend reverses. During the late 1990s, most suckers extrapolated out US stock returns over the long term and concluded that 6-7% real returns (roughly 10+% nominally) was the base case. Those suckers were wiped out. They didn’t recognize that the inflection point had come for equities.
I think we are at a similar inflection point for SF real values of its housing stock. So far (since Dec 2007 when I first posted on SS), my conjecture is holding up. We’ll see about the future I guess. (I don’t understand why everyone is always so emotional about things like asset prices – it’s just money, and w/Bernie firing up the presses, it’s sort of funny money anyway ;))
So by that token, the national 2.3% would be of little meaning as well. I suppose it would be interesting to break that 60 year spectrum into 1950-80, and 1980- 2009. Weird thing is, 50-80 was following the national average than 80-09 would be averaging north of 6%! It’s a rough breakdown of 2 time periods, but I think the rise of silicon valley as well as a host of the boutique/superstar city accolades specific to SF went hand in hand with that (admittedly) spectacular 30 year ride.
But from my POV, those two major drivers have not fundamentally changed. Even with this recession (which certainly is slowing things down). As I have pointed out in numerous posts, tech+bio+apt energy as well as SF’s boutique appeal are still there in spades. Now 20 years from now, I dunno. And I never heard from you on the richard Florida stuff. It’s all based on interesting primary and some secondary research. Have a look-see at his web site.
Interesting graph on 1MM+ home sales in SF:
http://bitcast-a.v1.sjc1.bitgravity.com/minyanville/assets/FCK_Aug2007/File/Nico/sfsales.jpg
jorge- what’s the source for that? (i’m guessing some wealth/hi end tracking service??)
45yo — patrick.net
45yo,
Jimmy’s probably right about the image source. Found it through this link on the Jumbo Prime market:
http://www.minyanville.com/articles/fre-fnm-housing-foreclosures-subprime-end/index/a/21980
And that Pottery Barn staging is just incredible. I hear Pottery Barn makes most of their revenue these days from staging…
The actual source of the chart is Cirios Real Estate that partners with Minyanville.
This site is worth combing through for data hogs like me. of course they are plugging their own valuation product which is natural (has anyone used it among the plugged-ins?). Quite a bit of very valuable data for free.
http://ciriosvaluations.com/2009/04/
That chart is not SF, but “Bay Area.” Still want to know where you got your 8% down from peak to 1/08 also.
I think this is the most relevant story re the SF real estate market — the near-complete dearth of sales in the higher end. From what I can glean, March only saw 11 sales > $1.5M (10 SFRs and 1 condo). MLS shows 247 listings in that price range — almost 2 years of inventory (and 85 new listings in March, so the backlog is growing). And not a single sale in March in that range went over asking. The low end (<$700k) has picked up because easy money is once again available there — although prices continue to fall. But the high-end is falling apart. The only question is how many of the sellers are willing/able to simply refuse to sell, because buyers clearly are not paying (or, more likely, cannot pay) what they are seeking.
FSBO may have better numbers, but from what I can find March ’09 sales were:
122 SFRs, median $672k
106 condos/TICs, median $640k
March ’08 had (I think) sales of 149 SFRs and 127 condos/TICs, both way down from ’07 — don’t know the medians.
@anonn,
Yes, it’s the BA. Typed a little too quickly.
The point about NVJ’s statement was that he was using this particular sale to gauge an overall percentage drop in the market. The assumption that the Noe market dropped only 8% based on this property getting its ask only works if the last sale (1/08) came at exactly the peak. For example, let’s say the market dropped 10% from a peak in 6/07 to 1/08 (Just making up the numbers/dates to illustrate). The total market drop from peak to date for this property would be closer to 17% based on losses that had occurred prior to the last sale.
I understand what you are saying. But I think one would be hard pressed to find much of a difference between peak 2007 Noe values and the very beginning of 2008. The dataset is going to probably be small, first of all. And secondly it will be rife with exceptions.
That’s the point — both sides pick and choose their data points, while accusing the other side of doing the same.
As a reader, I don’t mind as long as it remains entertaining (anonn, your “day job as a lawyer doesn’t allow for it” comment in another thread was comedy gold, thanks).
Eventually, there will be enough data to decide definitively one way or the other, so keep the discussion going 🙂
@anonn,
I agree regarding dataset and exceptions. Finding the true peak is also near impossible in such a small market. Hence my objection to the use of this single apple as an indicator of anything other than the perceived value of this property by two different people at given points in time. I recall many other Noe properties doing much worse than -15% from peak. I imagine a few may have even have beat -8%. Most of this data won’t even be clear until the trend extends out for a few years, as RE price is pretty sticky.
Amazed at a transfer away? Why? There is only so much room at the peak. The established pattern is for both maturing enterprises and deadwood to be frequently flushed out. Once some truly new contribution has become ordinary and well known, why would it need to pay a premium to be based here?
It might be possible to reduce the emotionality by looking at similar cases elsewhere. There is much talk about production moving to China, but a careful look at value chains shows that much of the money made from such shifts in production goes to Hong Kong and Singapore to pay for costs of deal making, legal wrangling, arrangements for shipping, and of course insurance because we wouldn’t want anything to happen to these beautiful items, now would we (wink, wink, nudge). Strong additions of value don’t just pop up in random locations, they get stuck in place and follow power rule distribution patterns.
Mean reversion of SF Bay Area real estate would take prices back to 1990s levels, in inflation adjusted numbers. Somehow those mean reverted prices were and likely will continue to be in the future around double what units cost in flyover territory. Is it really so hard to figure out why that might be? Some look at these numbers and see San Francisco withering like Detroit, others see the usual pattern and expect another wave of high value innovations to come from here.
Saying that growth is consistently around three percent or so demonstrates exactly the opposite point intended. Because growth is steady it becomes precious such that having a greater share of that growth than others, even if only marginally so, is a major advantage especially over significant periods of time.
In real terms what this means for 714 Duncan is that its value is headed back down somewhere below a million dollars. That may be a shock for inexperienced junior agents who have built careers while taunting renters for not having money or courage or blinders or whatever it took to buy. However, even at the corrected valuation, which will take some time yet to show up, the price will still be a shock for people in low growth areas.
(anonn, your “day job as a lawyer doesn’t allow for it” comment in another thread was comedy gold, thanks).
(trip, your “True, my day job as a lawyer doesn’t allow for it. But your day job as a realtor does.” comment in another thread was comedy platinum, thanks).
As far as I can tell, not much in the way of “pent up supply” (read: foreclosure activity) in this area. As noted before, a couple of duplexes for the enterprising developer or condo converter…
“As noted before, a couple of duplexes for the enterprising developer or condo converter…”
I looked into both of them, EBGuy. Thank you for the tip. If you would like to know my opinion and the various ins and outs of why neither is a particularly good play, you know how to find me.
These corporate real estate homes are great for real comps. It used to be that these guys would price a home a few points below market and they would get scooped up fast. This home, and the “Fall” home on Waller are both in this situation and neither are moving. I suspect they will both close at lower than current ask. These companies don’t like to hold these things too long.
neither are moving
How long has this home been on the market?
@SS Editor,
Did you correct the 83%=17% in my earlier post? If so, thanks. Also, I think this further validates the requests by many for an edit option. I could have been eaten alive for claiming an 83% drop in Noe. My life depends on this.
Regardless, your efforts are appreciated as always.
826 Duncan is also for sale at the same price ($1.295M), and might be an interesting “comp” for 714 Duncan. It’s attached, 3/2, renovated, no square footage listed:
http://www.redfin.com/CA/San-Francisco/826-Duncan-St-94131/home/1311596
It last sold for $1.325M in 2005, so at 38 DOM, it looks like a loss is assured.
A post above noted our graph of Bay Area home sales over $1,000,000. Here’s a link to the same graph for San Francisco Single Families…
http://ciriosvaluations.com/2009/04/07/san-francisco-home-sales-1000000/
Any more “data hogs” out there looking for more analysis, just shoot us an email through our Contact Us link.
Andrew — thanks! Nice graph! I think if you added the Q1 ’09 stats in there it would be down to about 55 sales.
I’ve said many times here — the collapse in sales outside of the low-end is the real story in SF real estate these days.
the collapse in sales outside of the low-end is the real story in SF real estate these days.
And which collapse would that be? What is the low end? Seven or eight million plus properties got into contract today. You love your overstatements, Trip. “Collapse” ?
anonn – how do you define collapse? Here are the number of sales above $1 million for the period Jan 1 – Apr 7 by year (SFH’s + condos for San Fran):
2009: 120
2008: 302
2007: 312
2006: 301
2005: 286
You have to go back to the 90’s to see fewer $1M sales (for the YTD Apr 7 period) than 2009.
And the $1M threshold is in nominal dollars. There were more million dollar sales in 2000 (in 2000 $’s) than there have been this year (in 2009 $’s).
I wouldn’t define it purely by volume. Why would you? Also, it is clear that some properties are still selling for peak or near peak prices, and I think that’s contrary to the term “collapse” as well. One hundred twenty is way down, certainly. But it is not oblivion.
Sure, anonn, it makes no sense at all to define a “collapse in sales” by looking at sales volume indicating an extreme fall-off. Unassailable logic, once again.
Q1 ’09 data is looking pretty slow, but Realtors are notoriously slow to update MLS — we don’t trust data that isn’t at least 2 months “seasoned.”
Volume doesn’t necessarily correlate perfectly to prices, to be sure, but less liquid markets are certainly subject to wilder price swings….in this market that means swings down.
From everything we look at, San Francisco is still behind the rest of the Bay Area in terms of prices falling. They are coming down to be sure, but prices have held firmer than most other areas.
Collapse connotes a market that is seeing nothing selling for former prices. Collapse connotes an ending. You parse your way, I’ll parse mine. But my logic? At least I think. You simply mock, and that is child’s play.
Andrew – good point about some Realtors being “notoriously slow” to update their MLS records (ie to report sales). You shouldn’t have to wait 2 months – the rules say 2 days! I find only a relative few reportings are more than 2 weeks tardy (5 – 8%). It’s annoying for those trying to do timely analysis – but it’s not a huge factor. In my experience, the SFAR has more tardy reportings than most other MLS’s.
I should have said that the SFAR has a greater % of tardy reportings than other MLS’s – not absolute numbers. With the low overall sales volume here, you would think that timely updating wouldn’t be a problem.
“You simply mock.” Anonn, mocking is all you do on this site. And you don’t even do that well as it is apparent that you do not comprehend the point you are mocking two-thirds of the time.
SFAR data is lousy anyway — is it really that hard to put in square feet? But maybe that’s the point….
We are extra careful about new data since we don’t want to be alarmist about markets that already declining … no need to make things worse by reporting under-reported stats!
When this sells for asking, will you [LMRiM] shut up about the “prices *must* be down more than 5-10%”?
714 Duncan just cut its ask to $1,250,000, 12% below its 2007 sales price. It does look like NV is showing relative strength, though, compared with just about every other area of SF. There might still be time for you to get out, NVJ, before the full scope of declines unfolds 😉
You are on one today, man. If myself, NVJ, 45 YO, or any of the other more bullish posters used bold type in searching/flaming attempts to posit individual properties as correlating to certain years on here? The whole site would get derailed into bickering for a day or two.
Down to $1.195M ($583 psf), now 15.4% below its 2007 sales price (no bold this time, just to make anonn happy).
I’d guess this 714 Duncan comp in the making is bad news for 826 Duncan, already listed below its 2005 price:
http://www.redfin.com/CA/San-Francisco/826-Duncan-St-94131/home/1311596
Down to $1.095…
“Sale pending” sign outside 714 duncan.