As a plugged-in reader points out, the Jeremy Kotas re-designed 123 Laidley has gone the rental route. Now asking a “PRICE REDUCED” $5,550 per month.
And now that we have an idea of potential income (or at least a ceiling), it’s interesting context for both the sale in 2003 ($1,042,500) as well as this past October’s asking price ($1,700,000).
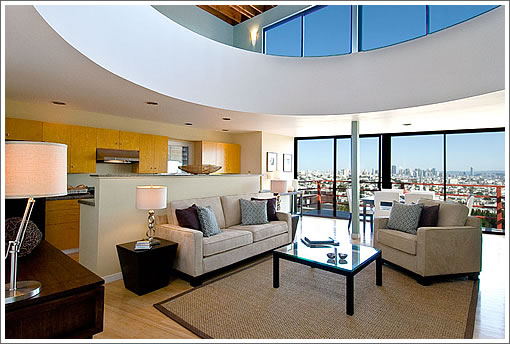
∙ $5550 / 4br – PRICE REDUCED Stunning One-of-a-Kind Home in Noe Valley [Craigslist]
∙ 123 Laidley (To Which Jeremy Kotas Added A Bit Of Height And Flair) [SocketSite]
It seems that the longer this downturn lingers, the bigger Noe Valley grows. Isn’t this Glen Park?
Seems like a very fair price for rental. Great place to have a party. Lets hope that rentals keep the market from tanking. we all need a place to live.
Everyone assumes that rents will hold steady. I’m afraid that we’re already seeing a weakend market for rentals that will surely trend lower along with the market as a whole. You can rent a Single Family home in Pacific Heights for less than $5500.
I’d guess that 95% of the people on here do not think rents will hold steady
Anon Blanc,
We all do need a place to live, most of us just don’t need to overpay for it.
It looks like they put a lot of money into a remodel for the privilege of losing a lot more money down the road. I agree with eddy on the price assessment and location comparison. The NOE bubble is bursting hard and fast. I can only guess the google bus is running out of gas.
“Juct Reduced” Ast now!
The high seller expectations has cost their realtor a lot of $$. This realtor should have thought about managing those expectations from the start.
He or she would have made a lot more money and the seller would have come out ahead, too.
To ask the obvious … what does this asking rent (assuming they can get it) tell us about what the market cost/value would be in a sane/normal market (standard multiples and what-have-you)? I’ve often heard a figure of 100x rent bandied about (amongst other clueless newbies to the ownership world, so I’ve always taken that w/a huge grain of salt). But that seems (?) like it would imply a price selling price that’s a bit low for this thing even in today’s market ($550K)? Although it IS Glen Park I guess…
eddy, I just did a search – albeit very quick – on craigslist looking for a SFH in Pac Heights and couldn’t find anything near that price.
Only 1 but it was lower pac heights.
The 30 year average SFR price/rent ratio in the SF MSA (SF, Redwood City, San Mateo) is about 18.
So, 18X$5500X12=a shade under $1.2M
As with other areas, prices are now well under long-term average price/rents, and are approaching the historical US average of 15-16X annual rents for SFRs.
e.g. my house would probably rent for $2100-$2200.
$2100*12*15=$380K. I bought it for $410K. oh well.
David,
100-150 is what I work with when investing in rental property. The closer to 100 the better. I’ve gotten deals under 80 but this were exceptional deals. I do not hope to have the same luck twice. Of course this ratio can be higher and stay there, no doubt and your 180 could be the line in the sand for market stabilization. But there are 2 kinds of residences to consider:
With SFHs you’re competing with people looking for their dream home and people tend to be less rational, whereas for condos the business is different.
Rental investors in condos will look at cash flow and net ROI. Live-in condo owners will also look at the rent-vs-own factor. Which is why I’m investing only in condos as they tend to be more rightly priced. Plus you can buy several and spread your risk if you’re lucky enough to be able to do that. But I’ll be hunting for a house in a year or 2 for myself as well though, if prices still keep coming down of course.
I’d be interested to see the source(s) of the 180 or the estimates you used, btw.
@DanRH, you are not good at searching. There is at least one very nice one in Prime SF. And there is a second as well, but it’s not very nice.
[clueless newb]
1 – Your name got me into trouble with someone lately. I’ll use brackets for your name from now on! I never call people names. OK, I called someone a Realtor once and he was not. Apologies to the guy.
2 – I am throwing 100-150 out of nowhere, sure.
Take a $1M property. 20% down, rate at 7%, mortgage interests = 56K the first year minus taxe breaks = 4K interests/month. 1K property tax/month. Maintenance and provision for repairs: 1K+/month. Opportunity costs on the 200K down: 1/2+ K. Tax break on the property tax: 200-300/month. If you are lucky, you’re spending 7K for the place.
Say you are using a 200 ratio. The rent is 5K. Minus the 7K that’s 2K net loss/month. Not a very good iinvestment.
At 140, you are starting to break even.
At 100, you are making real money.
18 x 12 = 216.
That number is preposterous and is by no means any form of long term average. Averages before the bubble years were about 100.
This is interesting.
DOM, where are you finding properties these days that sell for, say, 370,000.00 and rent for 3,700.00? The closest I’ve ever come to experiencing this kind of ratio was in 1974 when my family was paying rent of 250.00 a month for a house that sold later that year for 28,000.00. Even so, that’s a ratio of 112, not 100.
A table in a 2007 article in Fortune
http://money.cnn.com/magazines/fortune/price_rent_ratios/
gives the following 15-year average P/R’s (price-to-rent) ratios: National 16.9; San Francisco 27.4 The table uses a yearly rather than monthly rent. Converting to monthly rent produces: National 202.8; San Francisco 328.8. Remember this is the 15-year average. It would be interesting to see the 20 and 30-year averages.
A ratio of 100 converted to a yearly-rent P/R is 8.33. The lowest ratio in the table is Pittsburgh at 10.6 (127.2). Detroit is a close second at 10.9 (130.8) . Curiously, though, Detroit’s 2007 P/R ratio had dropped to 10.3 (123.6).
So DOM, how do you do it? Are you finding your properties in Detroit and Pittsburgh? Please tell us, we’d all like to know.
The average, historic asset-price/rent ratio for owner-occupied dwellings in SF is, in my view, the most important thing that any would-be buyer should know. The second most important thing is the average (i.e., normalized) market rent for the unit he/she is interested in buying. Alas, I don’t know of any reliable source for either piece of information.
As I’ve posted before, the CEPR (a DC think tank that was way ahead of the curve in calling the real estate bubble) says that 15:1 (based on annual rent) is the typical long-term ratio for owner-occupied housing in much of the nation. It strikes me as plausible that the ratio is somewhat higher for luxury housing, but I’ve not seen statistics to back up (or refute) that conjecture).
The very high ratios one sometimes sees bandied about for SF (as in the Fortune article referenced above) strike me as implausible–most likely, the author of the report conflated average rents with market rents (in most cities the two are pretty close, but not SF b/c of rent control).
Like DOM and tipster, I would *really* like to know what data David has to back up his 18:1 figure for SF. Please tell!
Of course rent control is going to throw this all off. But 18 seems plausible for market rents, surely?
And yes, Salarywoman. Good question. I’d like to know why some people on here aren’t already buying in Richmond right now them.
salarywoman,
The 100 or less are pocket deals, distressed property and in Paris, like a tiny studio gotten for 30K rented for 500. I got 100-120 ratio with 1BRs (in Paris too) on the open market that I was buying for 100K and renting for 1000/month. This was 6 to 14 years ago. The property prices tripled and quadrupled in 10 years since and the price to rent ratio went way higher than 200+. It made sense to sell.
But even with these low low prices the costs associated with the properties were often barely offset with the rent. I was OK though once the places were paid off. Maybe 5% net on the rent.
I am not saying these CAN be found in the current environment for retail property. Of course if you buy a whole building you might get closer to a good business model. But RE prices in SF are way too high for that, ask the Lembi who were losing 2K a unit on property they got foreclosed on.
Many rental investors are emotional about RE and are grossly underestimating their costs. They are overpaying but appreciation usually bails them out.
I’d like to know why some people on here aren’t already buying in Richmond right now them.
Because prices are coming down in SF. Why buy in Richmond when you can very likely have a great deal in SF in 2011? Patience might bring great rewards.
The Fortune article includes a complete explanation of their methodology. The figures used were supplied not by the author but by a research firm called Property and Portfolio Research. I don’t know anything about them. I can well imagine, though, that the difficulty of calculating average rents in a rent controlled city could have led them to use market rents instead of average rents. But for the property investor looking at condos or SFRs, which are not rent controlled, their data would probably be accurate enough, as the investor would be expecting to receive market rents.
Let’s look at what the break-even rent, the rent where the cost of ownership would equal the cost of renting, would be for a hypothetical 1,000,000 condo in SF, assuming 20% down and a mortgage of 6%. Monthly payments would be 4,796 a month or 57,552 a year. Assume HOA dues of 850 a month. That’s 10,200 a year. Property tax at 1.3% is 13,000 a year. Condo insurance is 500 a year. Let’s add in 75 a month for misc interior maintenance. That’s 900 a year. Let’s further assume you could have been receiving 5% on your 200,000 down payment. That’s an opportunity cost of 10,000 a year. And a total cost of 92,152 a year to own.
At a marginal 45% state + federal income bracket there is a tax savings of 21,600 on interest, 5,850 on property tax and a tax hit of 1,500 on your 5% return (assuming it’s cap gains and/or qualified dividends). This gives us an adjusted total of 63,202 a year.
The break-even rent is 5,267. And the P/R ratio is 15.82 or 189.
If the interest rate is higher or if you are in a lower tax bracket or live in a lower tax state, you would need a lower P/R (i.e. higher rent) to break even. But I’ve typically seen 175 given as the P/R where, for most people, the cost of renting is about equal to the cost of owning.
The break-even rent for investors is different, though. They can only deduct expenses up to the amount of rent they receive. And since the rent is taxable income the result is a wash. The break-even rent for an investor thus equals the cost of ownership without any tax breaks. For the same 1,000,000 condo that would be 82,152 a year or 6,846 a month, a P/R ratio of 12.17 or 146.
Pulling together some purchase prices and rental rates for a few properties that I know about in SF a 30% reduction in value would bring their P/R ratios down to about 200, assuming no reduction in rents. In any case it is reasonable to predict that SF prices will finally stabilize at a P/R ratio of 175 to 200. I very much doubt they will fall to 100. Everything I have been reading on this topic has supported a historic national average of about 200 going as far back as 1960.
DOM,
Ah, Paris….
And thanks for your reply. I’m curious, though. If you bought for 100,000 and rented for 1,000 a month, what were the costs that kept these from being cash flow positive? High interest? High taxes? Big ticket maintenance items? It’s clear the P/R ratio alone isn’t enough to determine if a particular RE investment is a good one. What were your particular pitfalls?
Thanks, Salarywoman, for your perspective. My one caveat to your analysis is that you’re probably overstating the tax benefits, for reasons that LMRiM explained in a post a little while back.
Yes, I think that is the correct analysis Salarywoman. But even with a decent formula, the assumptions for the numbers you plug in are important. In addition to overstating the tax benefits (nb that the tax benefits are also reduced over time as principal is paid), your understating the property taxes (rate is 1.163% in SF) and understating the insurance costs as well. You also have to factor in transaction costs (got to feed those realtors) which have a dramatic impact unless you stay in a place a long time. Missionite did a very good rent vs. own spreadsheet a while back.
You do not have to factor in transaction costs vis a vis realtors on the buy, only closing costs. On the sale, sure. But we are not talking about sales. (Nor for that matter would everyone factor in opportunity costs, but she did.) Also, according to you Salarywoman actually overstated property tax, Trip. But it is actually a sliding scale and you are both wrong there.
Yes, I agree with most of your caveats. But these are just back of the envelope calculations. The prop tax and insurance figures are from an actual property, though. The tax issue is particularly thorny due to the deduction phase out at higher income levels. And at lower levels, of course, the bracket would be quite different. Each individual has to compute their own particular situation and what pencils out for one person will not work financially for another.
In addition I did not include the opportunity cost on the 200,000 down payment in the investor scenario because I believe investors should not just figure out what will give the highest potential return, they should also diversify. But there is a good argument for including it. It all depends on what question you are asking. “Is this a real estate investment that will carry?” vs “Would I be better off putting 200,000 into this property or into tax free munis at 5%.”