An excerpt from Bill Gross’ August investment outlook (simply titled “Mooooooo!”):
Here is one asset [homes] that all observers can agree is going down in price for justifiable reasons. Maybe not Donald Trump’s Palm Beach mansion at $95 million big ones – thank you very much – but everybody else’s. They’re going down because quite simply, they went up too much and were financed with excessive debt. The housing bubble was well inflated by low interest rates, easy, and in some cases fraudulent credit, a lack of federal and state regulation, and a gullible public who read the history books for the past half century and knew full well that home prices never, ever go down. Not much of an enigma there. No riddle to be solved it would seem. It was simply a fairy tale too good to be true.
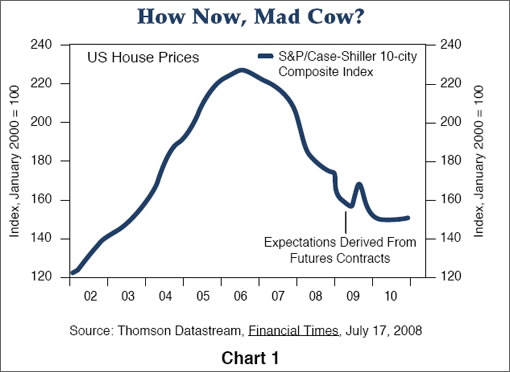
Yet housing, unlike other asset classes, carries with it an aura more like a bad dream than a fairy tale. Unlike the frog that when kissed turns into a handsome prince, housing can morph a froglike economy into something resembling Godzilla. That is because it is the most levered asset class and the one held by more “investor” citizens than any other. U.S. homes are market valued at over 20 trillion dollars with nearly half of the value supported by mortgage finance of one sort or another. At first blush that appears to be reasonably levered, but at the margin, homes purchased in 2004 and beyond are now at risk of turning upside down – negative equity – and there are some 25 million or so of those. The “upsidedownness” in many cases results in foreclosures, or outright abandonment and most certainly serves as an example of what not to do for millions of twenty-somethings or new citizens choosing between homeownership and renting. The dominoes fall month-by-month, forcing prices ever lower as shown in Chart 1 provided by Case-Shiller. An asset deflation in turn becomes a debt deflation, as subprimes, alt-As, and finally prime mortgages surrender to the seemingly inevitable tide. PIMCO estimates a total of 5 trillion dollars of mortgage loans are in risky asset categories and that nearly 1 trillion dollars of cumulative losses will finally mark the gravestone of this housing bubble. The problem with writing off 1 trillion dollars from the finance industry’s cumulative balance sheet is that if not matched by capital raising, it necessitates a sale of assets, a reduction in lending or both that in turn begins to affect economic growth, creating what Mohamed El-Erian fears as a “negative feedback loop.”
That one trillion sounds familiar. And that graph should look familiar as well. Then again, what would the head of a $830 billion investment management company that’s all about the bond know about debt? And it’s bound to be different here. Just look at all those mansions in Pacific Heights.
∙ Bill Gross’ Investment Outlook: August 2008 [PIMCO]
∙ They’re Betting Against Us (San Francisco) On The CME [SocketSite]
Can we superimpose the state of Maine on that graph just for kicks?
The risk of this causing a reverse bubble is certainly real due to the overall effects on the economy and inflation impacts on the real dollar.
I remain skeptical as to whether the $10M+ homes will retreat on the same scale. There is just so much wealth out there and these buyers are not feeling the same pressures as your ‘average’ millionaire buying a $5M house. LOL.
But overall, the economic impacts of all this are still only just beginning to be felt. You have to wonder how much bad news is being sheltered due to this being an election year. Neither party wants to deal with the “R” word. [recession]
Buy at your own risk folks.
No, not all observers can agree:
http://online.barrons.com/article/SB121581623724947273.html
[Editor’s Note: Note the Case-Shiller irony, don’t steal all our thunder, and cue the SocketSite foreshadowing…]
Nice to see Bill Gross finally admitting that a $1T loss is coming from residential real estate lending! It’s good to get this number out into the public consciousness.
Believe me, anyone with even a basic understanding of finance would have come to this conclusion more than a year ago, and if one had a greater than double digit IQ combined with that cursory knowledge, more than 2 years ago. Gross has understood this all along (as have the banks and Wall Street elite – maybe not the junior “scrubs” and investment bankers, but certainly the fixed income guys and traders who run those places…).
Next up, we should start to get estimates of how much loss will be sustained generally in the coming credit deflation. That number is going to be in excess of $20 TRILLION IMHO, as this would be the MINIMUM necessary to return debt/gdp ratios to just scary, as opposed to the armageddon levels that prevail today.
Yeah, that $20 Trillion dollar number is a low range estimate, given that the amount of financial instruments based on MBSs is over $200 Trillion. Thought that was a stunning number when I first heard it. Still think it is. Remember, our economy is only $14 Trillion in size.
That’s gonna leave a mark.
As for $10M+ residences (one defers from calling them “houses”, how gauche), remember that in serious downturns, extravagant displays of wealth are frowned on by society. So expect people to start “trading down”, rather than up.
Additionally, while the people who are using RE as a store of wealth will continue to buy outsized properties, those who are leveraging future buying power (like investment bankers) will find that there are fewer and fewer people willing to lend to them, regardless of their current income.
Everything’s about to get cheaper. The only question for the upper end is: “How much?”
Good news for those who are sitting on cash and waiting to buy. Bad news for the leveraged.
“…have the government buy one million new/unoccupied homes, blow them up, and then start all over again.”
That might just work.
Bill Gross obviously hasn’t been to SF lately. Everything’s fine here.
Hmmm…did anyone else notice the slight bump projected for 2008 before a slight further decline in 2009 and 2010? I wonder if this temporary rise is from people “catching a falling knife,” the government’s cash infusion, or something else…
I heard Bill Gross bought the penthouse at One Rincon…
From that graph, we have dropped from 230 at the peak to just under 180 now. The bottom is supposed to be 2010 at about 150. So we are about 2/3 the way to the bottom, the bulk of the drop is already behind us.
That seems about right.
“Bill Gross obviously hasn’t been to SF lately. Everything’s fine here.”
Foolio, you owe me a keyboard. I just spit my coke all over this one laughing at your post.
“we” is including Vegas all kinds of other places into this, but the level show here only drops to mid-03 yet that is not the same as 2000 as is often stated on this site.
Also, I find this is not very relevant to SF the stated calculations don’t take into account properties where the value went up to much (re-model), or at least minimizes it’s value. As is so often discussed here in “apples” lots of places are remodeled and sold for much higher in the city.
“Bill Gross obviously hasn’t been to SF lately. Everything’s fine here.”
Can you elaborate on the above statement?
the level show here only drops to mid-03 yet that is not the same as 2000 as is often stated on this site.
For the SF Bay Area Index, Feb09 futures have a decent amount of open interest and stand at 136.80. This is May 2002 pricing for SF and environs.
A single Nov10 traded at 130.4, which, if you are generous, puts us around Christmas of 2000. At any rate, those were the days, eh? Thirty percent appreciation in a year. Your mileage may vary.
Satchel – The article says that US homes have a $20T value with 1/2 of that in some type of mortgage debt ($10T). A $1T loss indicates a 10% haircut on average for the debt holders (and US taxpayers). Is this the correct interpretation?
Also, you have noted previously the unsustainability of the total US debt load (of some 350% of GDP). If GDP is about $14T, then the total debt load must be about $50T. So is it your view that $20T of this debt must be eliminated in order to bring the debt/GDP ratio down to about $30T/$14T or 200%? How will this debt likely be eliminated or reduced – and what are the potential consequences?
@Spencer: Glad I could amuse. Assumption of risk, though, on the keyboard.
@minerva: Just kidding…
@ Spencer
“Foolio, you owe me a keyboard. I just spit my coke all over this one laughing at your post.”
You might not want to check this space in the future, then, because I have a feeling you’ll be going through a lot of keyboards. He says the exact same thing every single day.
FSBO,
Your interpretation is basically right IMO. I haven’t looked closely at the numbers since I looked in 2006 and realized what was going on, but I sort of remember that at its peak US residential real estate was valued at $21-25T (nominal, and various estimates), which was up from about $10-12T in 2000. Mortgage debt went from around $5-6T to around $10-12T over this same period. There are private estimates for all these nummbers of course, but they all key off the Fed’s Z1 “telephone book” report. I can’t claim any bottom-up analysis of why I thought $1T is the right number of losses – it’s just a guess after all – but it mostly derived from my surmise that the 80/20 pareto rule would apply (hehehehe). $5-7T of losses to bring the Z1 housing value figure into trend (inflation is a reality we all have to live with – the real value of the housing stock should only be marginally greater than it was in 2000), and 20% of the loss would be borne by the smart (banks, investors, etc.) and 80% by the losses by the foolish (the population at large). Watching this unfold, I’ve revised my thinking. The smart will now be able to pawn off another 50% of the loss to the foolish (taxpayers, through bailout schemes). 🙂
The question about what happens to the debt is THE question of course. There are only 3 endings for debt, right? Paid off in full at some positive real interest rate; defaulted partially or in full by inflation (repaying debt with devalued dollars – in effect paying off the debt at some negative real interest rate); or repudiated outright. There will obviously be some combination of all 3 methods for the US – I think everyone agrees on that. Everyone is just arguing about the relative prevalence of the methods. As you know, for my part, I lean towards partial default through repudiation and partial repayment at some positive real rate, hence my belief that we will see deflation. Others obviously disagree!
Your numbers about the overall debt are in the ballpark. (Note that even at 200% aggregate debt/gdp, we would still be well above historical medians.) That 350%+ debt levels are unsustainable should be obvious, but after being in markets now for more than 15 years I am always struck by how poorly understood the concept of debt is, even by “finance people” who should know better. Debt requires a positive real interest rate, otherwise lenders would not delay their consumption today by lending. Even “risk free” debt requires some positive interest rate (over time, not necessarily in a 3-month slice of course). Risky debt (which might not get repaid) requires a higher real rate. On average, maybe the debt in the aggregate requires 2% positive return to keep lending flowing. Maybe it’s 3 or 4%. Who knows? I know that in order to attract funds for the i-bonds I bought in 2000-03, the USG was paying 3 – 3.6% real rates. Junk bonds historically have required 6-10%, real. Etc.
Inflation muddles our thinking (just as the Fed intends, BTW). Let’s say the average real rate on debt is 2% (it’s certainly much higher, but the low estimate makes the point). At 350% debt/gdp, the economy must produce 7% real returns JUST TO SERVICE THE DEBT! But it can only grow (at most) at 2.5-3.0%, and that includes 1% population growth. And there you have it. In order to service debt, productive income must be diverted to debt service, and living standards must fall. And if politically you want living standards to rise, well then you must “plug” the gap through increased debt (swiping the credit card to pay for the living standards increase). But of course this cannot continue indefinitely, unless you think the lenders are that stupid??
I hope that’s helpful!
This is the national (10-city) index. The SF area still has further to drop than the rest of the country according to those who put money on such things. HousingWire also reported a Fitch ratings analysis predicting home prices to decline by an average of 25 percent in real terms at the national level over the next five years.
Fitch predicts a bit worse for our area: “Some MSAs such as San Diego and San Francisco, CA are expected to experience home price declines by as much as 47 percent and 33 percent over the next five years, while home prices in MSAs such as San Antonio, TX are expected to appreciate by 7 percent.” Yes, that’s for the MSA, not just SF. But this is yet another data point indicating one would be well served to hold off with any housing purchase right now (unless you’re moving to San Antonio) — prices aren’t going up any time soon and are quite likely to continue going down for several more years at least.
I’ve yet to see any compelling rationale for our coming (delayed) reckoning here in the city, which many of you seem to predict. I’m no housing cheerleader but please help me understand the argument. I’m not picking a fight with anyone here, but please look at this post again and explain to me why we’re doomed: https://socketsite.com/archives/2008/03/are_we_now_detached_from_more_than_simply_the_fundament.html
First of all, the MSA has already fallen (correct me if I’m wrong) 22%? YOY as of the last quarter? And prices here have barely budged. So how dramatic will the impact be on SF given an additional (predicted) fall in MSA on the order of similar magnitude? Clearly the first 25-30% drop has been driven by the outlying areas, which are far more heavily weighted in the index, had far more (over)development, far more speculative lending/building, and have thusfar dropped much more significantly.
Just one other point: Who’s placing bets on advice from Fitch these days? This is the same agency that blessed all of this collateralized crap on the way up. You think they will have a firm handle on the situation as we climb back down? From where do they derive any credibility?
Yawn. Tell us something new. Every 5 year old knew this three years ago already. Someone please tell fluj, our supreme chearleader.
yay! meananon is back!
Just one other point: Who’s placing bets on advice from Fitch these days? This is the same agency that blessed all of this collateralized crap on the way up. You think they will have a firm handle on the situation as we climb back down? From where do they derive any credibility?
fitch is closing the barn door, neigh, slamming that barn door!
“From where do they derive any credibility?”
They must be reading the prophecies of diemos.
“yay! meananon is back!”
Fluj, that’s mean? Wow, so fragile.
“”yay! meananon is back!”
Fluj, that’s mean? Wow, so fragile.”
Because I responded to an out of the blue dis of “supreme cheerleader” with “yay meananon!” I’m fragile? naaah. It’s all in fun. Meananon is a name I made up a while ago for one particular poster, or three.
Of the $12.1T mortgages outstanding originated in this country, 80% are prime and 12% subprime. The issue now is prime delinquencies are rising at a faster pace (44% annual growth in prime delinquency rate at the end of Q1 and 15% sequentially) than subprime. This is unprecedented but prime credit deterioration today is supported by the performance of other companies like AXP. This is also why the notion of “good bank, bad bank” separations to preserve certain lenders has not occurred – with prime defaults soaring and with notional amounts so large, no mortgage lender today is “good.” To get to $1T of real economic losses you have to believe that prime defaults will continue to accelerate; home prices will continue to deteriorate significantly; and recovery values on foreclosed homes will be very low by historical standards. $1T is an unlikely figure because $1T of real mortgage losses would simply not be permitted by fiscal and monetary authorities.
$50T in total federal debt? Do tell where you get that number from.
That would be current debt plus unfunded future liabilities.
Sure, if you calculate that medical costs are going to increase at 7%/yr for the indefinite future, you get a really big number for medicare. But medical costs will not equal 30% of our total economy, one way or another that number will come down.
Stripping out Medicare, what is our total debt, including unfunded liabilities?
NVJim,
I think diemos is only talking about USG debt (funded + unfunded = ~$50T, I think). But the original debt/gdp “problem” I introduced above is aggregate debt (total private and “quasi-public” GSE debt + explicit public (USG + states)), which I guess coincidentally also equals just north of $50T.
Those aggregate debt/gdp figures don’t include ANY unfunded liabilities (no social security, no medicare/prescription drug, etc.). Even leaving aside the unfunded liabilities, aggregate debt is something north of $50T. I’ve seen various estimates of the unfunded portion of government liability, and these range up to an ADDITIONAL $50T (with the lion’s share being health care), basicaly consistent with diemos’ post. Because all the stats leave out the unfunded USG “mandates”, our USG debt is only something like $10T, or a little less than 70% of GDP. Not terrible by first world standards. Adding in Fannie/Freddie, though, and you quickly ramp up to around 110%, again not the worst but pushing it.
You’re right that medicare costs won’t continue to grow like it has. It can’t. My investment advice: go long euthanasia companies! Actually, it is inevitable (probably within the next 10 years) that as healthcare becomes fully socialized in the US (IMO, perhaps the worst economic mistake our country has ever/will ever make, except perhaps for setting up social security and medicare in the first place), that we will start to debate euthanasia in a big way (of course, it will be “hidden” through talk of hospice care, palliative treatment, etc.). My other, more serious advice is to make sure you go into retirement years with serious cash for you and your family’s medical needs. I fully expect to be jumping on a plane to have medical treatment done in India or China (or Thailand or Brazil – who knows?) 20 or 30 years from now! 🙂
(OT – I just looked back through some earlier threads and saw I owed you a response as to why I often talk in real terms when discussing nominal debt/nominal gdp ratios. Thanks for keeping me honest! I often conflate some ideas here, namely the way USG gets to “nominal” gdp. As I understand it – I’m NOT the world’s expert here on stat gathering, but it was explained to me a decade ago by someone who was! – the basic intuition is that there is no “magic calculator” running in all the businesses and homes in the US that the USG uses to calculate aggregate nominal GDP. The collecting agencies (BEA and BLS primarily) use all sorts of estimation methods for large swaths of the GDP figure, sometimes based on sampling and sometimes based on projection from prior figures. In these methods, many of the same adjustments – hedonic, chain weighted, etc. – that are used in inflation calculations are used to estimate nominal GDP too! And this process was “jump-started” in the late 80s/1990s as all the inflation measures were reconfigured. But, of course, government spending is pretty easy to calculate – GAO keeps reasonable track of this, even if congress can’t! – and so USG debt figures are accurate. Presumably aggregate private debt is accurate too, as the debt all needs to be issued and outstanding (actually lent by investors) by entities who have GAAP accountants. The result IMO (based on what my colleague explained to me) is that the denominator (nominal GDP) tends to grow faster than it otherwise would had the estimation methods remained constant, while nominal debt is a good number, leading to an understatement of “true” debt/gdp ratios. But like I said, I was being a little sloppy, and conflated a lot of ideas, and thanks for keeping the discussion honest.
BTW, if there are any government bean counters out there reading who could provide some more insight into how USG actually goes about calculating nominal gdp, or any links to indepth discussions, I’d really like to hear it/see the links.)
You’re right Satchel, I was, and you’re right that it’s the sum of public and private debt that matters for financial sustainability, not unfunded liabilities. The unfunded liabilities will simply be reneged on at some future date.
I am not going to get into a long discussion about health care policy on a Real Estate blog, but suffice to say that I disagree with you. We spend much more on health care than the other G8 countries, in both dollars and percentage of GDP, for no better measurable outcome. This acts as a tax that decreases our economic competitiveness.
Moving the implied liabilities of Fannie Mae and Freddie Mac formally onto the books will not necessarily cost the taxpayer anything. It depends on what the assets backing those liabilities are worth. When FDR set up the Home Owners Loan Corporation back in 1933, it issued $2B in bonds (a lot at the time) and assumed liability for most of the defaulting home debt in the nation. But by the time the HOLC closed up shop in the 50’s, it actually had made the government a profit.
http://www.nytimes.com/2008/02/24/business/24view.html?ex=1361509200&en=67ff4da9afdff62f&ei=5124&partner=permalink&exprod=permalink
It is deregulation that has gotten us into the mess we are in today and it is re-regulation that will get us out of it.