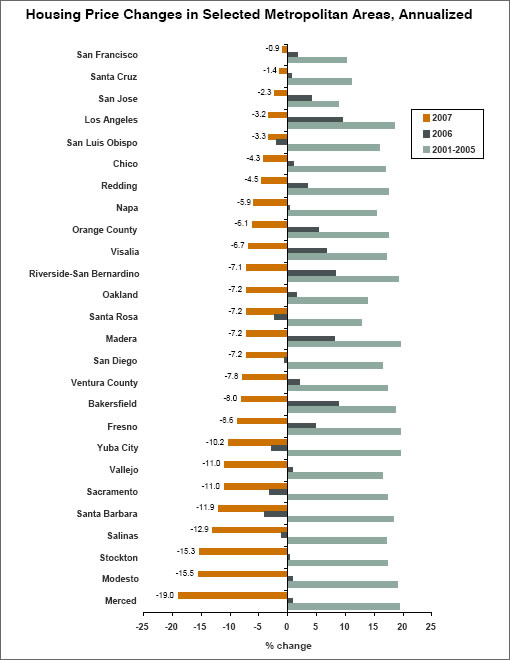
An interesting chart of California MSA home price appreciation as measured by the OFHEO*, put together by the Public Policy Institute of California (pdf), and by way of a plugged-in tipster. And an important observation which shouldn’t catch any plugged-in readers by surprise:
While California’s previous housing crisis (southern California in the early and mid‐1990s) was part of a broader economic slowdown, the relationship between housing and economic conditions today is less clear‐cut. In 2007, employment in Merced and Stockton grew more than 2%, despite crashing housing prices, whereas employment grew only 0.6% in California overall and even fell in Los Angeles, Orange County, Ventura County, and Riverside-San Bernardino – where home prices are holding up better than in the Central Valley.
*Note: For those who are unfamiliar, the OFHEO Home Price Index (HPI) is based on data from repeat single-family home sales, or refinancings, that involve conforming mortgages. Data from transactions involving either condominiums or non-conforming loans (two major components of the San Francisco market) are excluded from the Index.
∙ The California Economy: Crisis In The Housing Market (pdf) [ppic.org]
∙ OFHEO: U.S. House Prices Don’t Fall (But Do In CA And The SF MSA) [SocketSite]
what counts as a “house” in this analysis?
First of all, the San Francisco MSA here is much better defined than Case-Schiller IMHO. I say that because it doesn’t include Alameda and Contra Costa counties – which represent a lot of volume and have declined more than SF proper (i.e. – mix impact).
Two things that I don’t think are surprising, but I’m sure many of you will refute are: 1) The areas that rose the most during the boom are dropping the most now, and 2) SF MSA is basically flat. It seems it would need to start dropping pretty quickly and dramatically to get to the 30% decline we keep hearing about.
A house is a house, of course, of course,
And no one can count a house of course
That is, of course, unless the house is in the famous Noe Valley.
what counts as a “house” in this analysis?
The OFHEO Home Price Index (HPI) is based on data from repeat single-family home sales, or refinancings, that involve conforming mortgages. Data from transactions involving either condominiums or non-conforming loans (two major components of the San Francisco market) are excluded from the Index.
So, what you’re saying (essentially) is that none of the transactions in San Francisco are counted by the OFHEO since they’re (almost) all non-conforming.
It is impossible for San Francisco house prices to be detached from the conditions in the surrounding areas especially if they are within commuting distance.
While prices were rising, the most popular reason for the increase in house prices in Sacramento and Stockton was that Bay Area residents priced out of the region were buying homes there. This implies that on the way up prices were linked. Now that prices are on the way down have prices become un-linked?
It looks like the 2001-2005 number is % annual increase, not the total % increase from 2001-2005. Is this correct? If so things still have a long way to go to get back to 2001 prices, even in Merced.
Hey Gavin, no they are not delinked really. Remember most of the decline in SFO was in Jan of Feb of this year. This of course is being led by big declines in teh lower tier of pricing. The big question is are the lower tiers and condos Canaries in the Coal mine? oooooorr as some realtors postulate will the prices there stay flat. I am betting the 3 tiers will eventually converge around 115 or 130.
OFHEO contains a research note comparing their methodology with Case Schiller:
http://www.ofheo.gov/media/hpi/Reconciliation_Table_2007Q4.pdf
http://www.ofheo.gov/media/research/notediff2.pdf
What’s interesting, is the effect of including appraisals (during refinancings) as well as sales. Once appraisals are removed, the measured decline in home prices for the SF MSA doubles, according to OFHEO. A similar pattern emerges for other markets — those markets seeing an increase in value (Chicago) have the increase wiped out, other markets see a tripling of decline, etc.
This says something about the role of appraisers in the recent runup. While the majority of Americans believe that prices in general are declining, fewer believe that their own home or that their own neighborhood is declining in value, and OFHEO data shows some quantitative support for why this is the case.
[Editor’s Note: Great points. In fact, applying the Case-Shiller geographic boundaries to the OFHEO methodology suggests San Francisco home price appreciation of -0.52% from Q1 2006 to Q1 2007, but counting purchase-only transactions drops the measured appreciation to -7.70%.]
Outer Sunset It looks like the 2001-2005 number is % annual increase, not the total % increase from 2001-2005. Is this correct? If so things still have a long way to go to get back to 2001 prices, even in Merced.
Yup. But keep in mind that inflation alone should have boosted prices by 20% during the intervening period, so that buys you an extra year or two (depending on location). Also, there is an asymmetry because the percentages are calculated off different bases. For example, a 100% increase only needs a 50% decrease to cancel it out.
That being said, this chart pretty much confirms what most of us (at least, those who are reasonable) already know:
(1) Prices still have a ways to fall.
(2) SF, SJ, and Oakland were not immune to the bubble on the way up; they will not be immune to it on the way down.
(3) Point (2) notwithstanding, SF, SJ, and Oakland (particularly SF and SJ) did not appreciate as much on the way up, so they won’t deflate as much on the way down. If statewide prices ultimately fall 40-50%, then SF and SJ prices might fall by, say, 20-25%.
@mike who said “SF, SJ, and Oakland (particularly SF and SJ) did not appreciate as much on the way up, so they won’t deflate as much on the way down. If statewide prices ultimately fall 40-50%, then SF and SJ prices might fall by, say, 20-25%.”
I could be wrong but aren’t those prices annualized. ie 20% per year. i.e. your horizontal axis. It’s not like–during the whole period of 2001 to 2005 sf prices were up 17% total. thats the avg amount per year. correspondingly, when they bottom at down 20% which is where I think they already almost are, that’d be really lucky.
Cooper, are you using any data to suggest that SF prices are already down almost 20% or is that your gut feeling?
Certainly I’ve seen no price data to suggest that’s the case.
@REporn. Well i am using the case shiller data at -13.2 for january…its almost april now and looking at all the big price cuts..I’d guess we are at say 15-17% now..i.e. almost 20. and yep, that’s just a guess.
Ah OK, I didn’t realise you meant the price fall for SF City, Alameda, Contra, Marin, San Mateo all combined.
In that case then yup I agree its probably approaching 20% now – but with a HUGE variation of price falls within each of those areas, of course i.e they havent all fallen by almost 20%!
I didn’t realize that this was based on OFHEO standards, as those are fairly useless for the Bay area (no condos or non-conforming loans). That’s a bummer.
@ cooper: Case-Shiller is based on an MSA that includes SF, Marin, Alameda, and Contra Costa counties. The other three counties depreciated 16% in January (per Dataquick), and they represent 80% of total volume. For that reason, the Case-Shiller’s SF MSA index is fairly useless as a proxy of home price appreciation in SF. You could make an argument that the top tier homes in CS is correlated with San Francisco, but otherwise I think you’re making poor inferences.
Oops… per REporn, I realized that I left off San Mateo in my analysis above. If you add them in, SF is only 18% of the volume, and the other counties are down 14%. It doesn’t change the conclusion though.
Just looking at this chart, it’s pretty obvious that the places getting totally hammered seem to fall into two camps: either speculative overbuilding (Stockton, Merced, perhaps Orange County) or speculative lending (Oakland, Vallejo, or pick your subprime favorite). The geographies close to higher paying jobs with fewer subprime borrowers and less speculative land to develop are holding up better. It’s not rocket science.
For those expecting some kind of horsewhip effect where San Francisco falls off a cliff to “catch up” with the carnage in Stockton, I fail to see the logic in that argument…
I think it is important to look at the fundamental reasons for the run-up in prices and why prices in certain markets (SF, SJ, Peninsula) may not be affected as much as some pontificate.
Prices rose fastest in outlying areas of both NoCal and SoCal. Demand was skewed by easy access to credit and IMHO speculators looking to cash in on the RE investment craze in areas where prices were low when compared to the Bay Area. That is what ultimately drove prices skyward in areas like Vacaville, Hollister, Stockton, Merced, Sacramento, etc., and not normal fundamentals like job growth or population growth.
Now that banks own many of these properties, they are liquidating them at fire sale prices. It is these sales that are pulling down prices, and with no solid employment base/growth, these areas will likely return closest to their pre-boom prices.
SF, Peninsula, SJ were mostly immune to this phenomenon, and with job growth still healthy – http://www.sfgate.com/cgi-bin/article.cgi?f=/c/a/2008/03/22/BUAQVOFCS.DTL – bank REO property at low levels and supply still constrained, I don’t expect to see prices plummet here. No growth or small drop, yes. But not the 20-25% or more some are expecting.
theloanphd – Here are some quick facts from the latest US Census data that we can use to test your hypothesis about SF prices growing solely due to “fundamentals”:
Change in San Francisco County population, 2000-2006: -4.2%
Change in San Francisco County pvt employment, 2000-2005: -12.8%
Change in San Joaquin County population, 2000-2006: +19.4%
Change in San Joaquin County pvt employment, 2000-2005: +11.9%
Uh, yeah, clearly SF’s appreciation is all about “fundamentals” while Stockton is all about “speculation.” This took me all of 3 minutes to find on Google – I’m sure you could have looked it up yourself before posting your little theory.
People who think SF/SJ will see identical percentage declines to the outer-lying areas are crazy.
People who think SF/SJ will see no percentage declines are crazy.
Why are there so many crazys??
@theloanphd
The chart suggests that SF appreciated ~13% annualized between 2001-2005.
Meanwhile the economic fundamentals haven’t changed to support those type of gains in SF or the peninsula or SJ.
Time and time again it has been proven that Income, population growth, basically fundamentals don’t support current prices anywhere in the Bay Area.
I would like to see income data and population growth data for SF, SJ and the peninsula that supports a 10-15% annualized appreciation.
Actually, San Francisco’s population is at a record high, according to estimates by the California Dept. of Finance.
The US Census estimates population change based on how many income tax forms were filed, and by federal immigration data– it only counts people every 10 years. US Census officials concede that their estimates are based on limited federal data, and may be less accurate than the California Dept. of Finance estimates.
http://studycenter.org/test/cce/issues/49/49_pop799263.html
@lance–good point. that’s true about the noise of the other counties making it a noisy gauge for just the SFO MSA. They call it a greater MSA but it SFO itself does tend to lag price changes in other markets for some time.
The last correction showed how SF can catch up, at least part way, without any kind of “horsewhip effect”. Back around 1992-1994 places like Boston and chicago that fell faster sooner had not only recovered, but were seeing price increases. At the same time the pain in and around SF was extremely severe. It took a while to build, but inventory built up to the point that the area almost looked and functioned like a normal real estate market that presents various kinds of buyers with a range of choices. Appreciation in some places happened briefly between 1988 and 1996, but only a little. For the most part everything was down between 1% and 3% every year and inflation was running hot. That meant that 5-9% of the value was stripped away every year. By the time things turned around the real loss in value was essentially 30% across the board even in the finest and most desirable areas of SF. Back then large mansions were going for $1-2 million and less than a half million could by a lot of house.
This kind of thing can and will happen again, but it will be worse this time. With current inflation levels we only need about five or so years of relative price stagnation to take a huge chunk of value away. Just like last time people will come away from the experience noting that prices are still high and will fail to acknowledge the loss taken by buyers at the peak.
“…It took a while to build, but inventory built up to the point that the area almost looked and functioned like a normal real estate market that presents various kinds of buyers with a range of choices…”
Could it be that there is a natural lag in SF due to our “SF is special”, 7×7, etc. psychology ? Sellers who believe that they own a unique commodity will be more likely to hold out longer to get their (inflated) price and therefore will take a longer time to accept a fair market price ?
I don’t disagree that SF is special or that land is constrained. Both statements are true. But sellers are not in the best position to judge the fair market value of property of nearly mythical importance, especially in a declining market.
Even though a property is unique, special, valuable, etc., one cannot expect that it can remain detached from fundamentals forever.
Compare that to homes in the ever expanding Chicagoland or Boston metro areas : there’s no illusion of a limited supply.
I lived in the Boston area. It is at least as dense as SF Bay Area if not more.
@loanphd, dan, and others
The nice thing about San Francisco being both a city and a county is that we have decent census data available. For example, you can find household income statistics for the years 2000 and 2006 here:
http://factfinder.census.gov/servlet/DTTable?_bm=y&-context=dt&-ds_name=ACS_2000_EST_G00_&-CONTEXT=dt&-mt_name=ACS_2000_EST_G2000_P069&-tree_id=306&-redoLog=true&-geo_id=05000US06075&-search_results=01000US&-format=&-_lang=en&-SubjectID=14815801
http://factfinder.census.gov/servlet/DTTable?_bm=y&-context=dt&-ds_name=ACS_2006_EST_G00_&-CONTEXT=dt&-mt_name=ACS_2006_EST_G2000_B19001&-tree_id=306&-redoLog=true&-geo_id=05000US06075&-search_results=01000US&-format=&-_lang=en&-SubjectID=14830196
Looking at this data, we see that from 2000 to 2006,
First, note that the number of households *decreased* slightly, from 325K to 322K.
From 2000 to 2006, there was a slight growth in the number of households in each of the top income buckets:
household income | increase in percent of households
75-100K: +0.3%
100-125K: +1.2%
125-150K: + 0.1%
150-200K: + 2.9%
more than 200K: +2.5%
As an aside, both median household income, as well as aggregate income *fell* in real terms, from 2000 to 2006.
So, we have a picture of slight nominal household wage growth, and a slight decrease in the total number of households. That should take care of the “fundamentals” explanation of house price doubling during the same timeframe.
Now, let’s see what evidence there is for the “irresponsible lending” explanation:
The number of interest only loans grew from 18% of loans in 2002 to 70% of loans in 2005. In 2000, 15% of households devoted >1/2 of their income to mortgage payments. In 2006, the number grew to 24%. The number of households that devote more than 35% of their household income to mortgages increased from 32% to 40%.
Are the “undocument workers” counted in the population data? Don’t think so.
Are the “undocument workers” buying $1 million+ properties?
Fred: It doesn’t matter whether undocumented workers were counted in the surveys as long as they are treated the same in every survey.
They are likely to be the same fraction of the population in the 2000 survey as they are in the 2006 survey.
One possible way for the undocumented to affect the housing market is that they may have obtained more loans in 2006 than in 2000. This just adds to the “irresponsible” lending explanation suggested by “robert”
I wonder if the San Francisco effect is due to buyers who want a home, have not been able to find one in SF, and rather than buy somewhere else, decided to rent instead since renting in SF is cheap relative to buying.
Since they are renting (and thus still capable of buying), and they haven’t moved out of the city, their latent demand fills in what would otherwise be price declines.
This dynamic requires an environment where buyers are willing to rent rather than move if they can’t buy, which probably only holds in destination cities like San Francisco.
The undocument workers are not buying $1 million+ properties, but it seems like they are occupying lower end housing that pushes others into the higher end.
All I’m saying is that in my old neighborhood, there are a lot more cars on the street, people living in garages, etc., which implies more bodies. Just something to consider.
sorbet: You are not following your explanation to its conclusions.
If there were many renters in San Francisco ready to buy at the slightest drop in home prices you claim that it may hold prices up. But if they move from renting to buying they leave a vacant rental place which would presumably be filled by someone else moving in to the city. But as the population of San Francisco is barely rising for your theory to hold there would be many more vacant units in the city.
As there does not appear to be a sharp rise in vacant rental units I would conclude that “renters on the sidelines” is not a good explanation for the resilience of the San Francisco market.
I would like go mention the other San Francisco effect, which is caused mainly by a shortage of housing and Prop. 13. Now I am not proud to say this, but I own in the Marina about a block from the waterfront near Prado Street but live somewhere else. I changed positions within my firm and now live in another major city (better have some privacy), and rent in that city. My 2bd Marina unit is empty because I bought it over 15 years ago, and my taxes are so low I don’t want to sell, and I don’t want to rent it out. (Why bother?) The unit below mine was purchased at the same time by a woman who has since moved to New York. She has kept her unit also, let an ex boyfriend live there for a time, and now it sits Empty. She uses it as a vacation pad. Here is my point, why sell for many of us who bought in the late 80’s or early 90’s? My place is recently paid for, and the taxes are LOW, as are the HOA. In my 8 unit building, another one is now empty and owned by a retired couple from Napa who bought it for their college age daughter who ran off to L.A., they come down about twice every month for a night or two. As long as property taxes are kept below real values for people who bought more than 10 years ago, there is going to be a shortage of housing. If I had to pay taxes on the value of my unit today, I would have sold when I moved to my present location.
Okay, I need some basic understanding with the fundamentals because I am not seeing anyone take the dot.com bubble effect into consideration. Aren’t we in an area where housing prices were really effected by two bubbles, not one? Doesn’t this play into the landscape? Wouldn’t this data actually be limiting? Prices flew threw the ceiling from the late 1990s through 2001 here, not San Diego…
“my taxes are so low I don’t want to sell, and I don’t want to rent it out. (Why bother?)”
Why not find a decent property manager to handle all of the details. They take their 8% cut and the rest is free money, brutha !
Is your concern that if you want to move back or sell that it might be hard to get tenant out of your unit ?
It seems like a dual effect is in play here. Prop 13 makes it effortless to leave a unit vacant. Strong tenant rights in SF scares people from putting their vacant property to use.
Odd isn’t it ? Rules put into place to protect tenants actually reduce the supply and increase rents.
“Is your concern that if you want to move back or sell that it might be hard to get tenant out of your unit ?”
Yes, but more than that, my income is good, and the unit costs so little to sit empty.
Now, I am seeing the opposite where I rent now. In the city I live in now property taxes are 2.35% of REAL value usually re-assessed to updated property value every 2 to 3 years. Leaving a unit empty in this non rent controlled city is not an option for owners.
San Francisco is a city with an artificial shortage of housing because of rent control. Prop. 13 only makes it much worse. There is a building nearby on Pierce street where the owner has taken the top unit as his home, and leaves the bottom two units empty. He also bought years ago, and when the tenants finally left, he decided it was less painful to leave the units empty. This is a common story in many parts of San Francisco.
The dot-com bust happened in 2000, way before the crazy home appreciation. And even though it was a bust, alot of money was made during that time, and it did not just go away. Also, just because incomes are not appreciating, does not meant that the current home owners cannot afford the SF pricing. The idea that in aggregate incomes among the population drive prices may be true, but in SF only 25% of the population own, so as long as 25% can afford the current prices, it’s not a house of cards ready to fall. Besides, most home owners are not just going to sell because the current market value of homes is perceived to be crashing by some accounts. They still have equity and as long as they can maintain their mortgage, you are not going to see a sell herd mentality. Rise in interest only loans is not an absolute indicator of bad risk either. Some people look at that as tax deductible rent so to assume that a rise in IO loans is a disaster waiting to happen is shaky. Thus supply stays relatively limited and prices at near current levels. I keep seeing the word commodity, but that is not really doesn ot apply to housing in the same sense that it applies to stock or pork bellies, consequently the “fundamentals” not making sense is because they don’t apply to the degree that they would apply to true commodities. To the extent that credit is harder to get, that will drive up a correction, but again, if people are holding out because they can, they will more than likely ride it out until prices appreciate.
The downturn in the early 90’s in SF may have also been unique and I have my own theory on that. The earthquake had just hit in 89 and the demand for housing was impacted. Not only that, but the AIDS epidemic seems to be a distant memory for many these days, but this City was devastated by it and everything was impacted by it, including housing.
Prop 13 is only one component of housing prices. It is an advantage to some, and the poster with the empty house, one other reason it is not for sale is something called capital gains. If prop 13 were repealed it should also impact rental buildings and the cost of rentals will go through the roof as it should, cost goes up for everyone, renters and owners alike because it will be a tax on the value of the property, not what is paid on it or the revenue stream.
Every cycle is unique and trying to make sense of it is always a guessing game no matter how much information you have. After the dot-com bust I was expecting to see the prices go down. Who knew that people would move their money to real estate and that combined with 911 and low interest rates would double or triple the prices I had thought were already too high in 2000. If you are a qualified buyer, it may be a good time to buy in the near future. Some properties out there are in a position to be negotiated, but you have to be in the game and be willing to seek them out. In the end, I do believe prices will come down some to correct the mess created over the last couple of years, but that in itself is a moving target and will vary by location and quality, and yes, what some people are willing to and able to pay. I don’t expect a collapse of 30%, not from here going forward. There are still alot of well off people in this town.
@robert,
I will try to make some sense of the data.
1. Notice the income in the census study is adjusted for inflation. The “doubling” of the RE price is not inflation adjusted. Actually, the precise number should be about 70%, since the annualized appreciation is about 10% for those five years.
2. Since 70% of SF residents are renters, I would like to find out what the income level of the top 30% percentile. By studying the census tables, in 2000, the 30 pecentile is about $90K. It is a little over $100K in 2006. The 30 percentile income level increased about 10% to 15%.
3. The 30-year fixed mortgage rate dropped from about 8% in 2000 to 6% in 2005. That’s a huge drop. If you ever buy a house, you would know that increases your purchase power by about 25% to 30%.
So, among those 70% appreciation from 2000 to 2005:
15% is pure inflation
15% is income increase
30% is due to mortgage decrease.
Compounded, the appreciation is almost EXACTLY 70%: 1.15 x 1.15 x 1.30 = 1.72
Fast forward to 2008, what happened last two years?
1. Inflation continues at 3%/year, total 6%
2. Income continues to increase moderately
2. Mortgage rate increased from 6% to 6.5%, equals about 8% decrease in purchasing power.
The inflation + income increase is canceled out by mortgage rate increase, so we see the price flat (or even a little down).
The biggest factor is the mortgage rate. People buy based on the monthly payment, not the total price. If mortgage rate goes back to 8%, I am sure the price will drop another 20%.
Great analysis John. Question now in my mind is if the interest rates fall or stay the same for a while, have we hit bottom?
@ John
You are assuming most people bought with 30 year fixed mortgages. A lot of people overextended and bought more home than they could afford using ARMs (I/O, Option, 3 /5 year) at much lower rates that 6%.
Assuming that to be the case the interest rate increases that are happening and will continue while the banks are in financial crisis, provides enough evidence to support a larger than 20% drop.
It’s alarming that homes are returning to the market within 2 years of purchase.
Interesting analysis John. So during this manic period, buyers “spent” every dollar that they enjoyed from higher wages and reduced mortgage costs (from lower interest rates and other “innovations”) on bidding up housing prices. And then they bid prices even higher since the % of household income devoted to covering the mortgage rose significantly too. I guess this explains how prices could double. Question is why? Why did buyers feel compelled to spend every available dollar on housing?
@FSBO,
I didn’t say they spend every dollar that they enjoyed from higher wagers and reduced mortgage cost. They may have spent less. They may have spent MORE. I am only trying to find the contributing factors to the 70% gain.
The real finding is, a 2005 RE buyer does not have worse burden than a 2000 buyer, due to the inflation, income increase, and lower mortgage rate. There may be a few percent of “bubble factor”, but I would say that slice is very small (for SF).
If you don’t believe me, do your own calculation. Calculate a family buying a 400K house in 2000, with income of $70K – the inflation adjusted (to 2006$)income level of the top 30 pencetile is about $90K – with a mortgage rate of 8%. They calculate the same for a family buying a 700K (70% increase from 500K), with income of 105K and mortgage rate of 6% in 2006. I will bet the monthly payment is within few percent. Add the tax deduction, it is even.
@akrosdabay
Good point. People used to buy with 30-year fixed. Now 10-year interest-only and 5/1, 7/1 are more common. That adds even more (short-term) purchase power.
@viewlover
That’s the question, isn’t it? I am sure Fed and US government is trying everything possible to keep the mortgage rate low. It is going up because of the “flight to quality”. Investors are shying away from mortgages to US treasury, causing treasury rate to drop, but mortgage rate to go up. Will it continue? I have no idea.
@all
Another factor that I didn’t mention – the census income data does not capital gain from stock trading. A lot of people in bay area have a big portion of income from stock options. We don’t know how much net income people get in 2006 vs 2000.
John,
The income figures are not inflation adjusted for the 2000-2006 period, but for the 12 months of the year in which the survey was taken. This is why the 2000 data says “in inflation adjusted 2000 dollars” and the 2006 data says “in inflation adjusted 2006 dollars”.
You may want to revisit the rest of your arguments accordingly. For example, you are double counting by saying that 15% is pure inflation, and that 15% is income increases, because in real terms, income has declined.
FYI, $1 in 2000 was worth $1.20 in 2006.
2 — Correct, which is why I looked at the those upper brackets containing the 35% or so of homeowners.
I think a 10% increase in nominal terms is consistent with the data, but not explicitly in the data — you have to remember that SF has a clumpy distribution. Here, it helps to look at median and aggregate income growth, as the latter is skewed towards the highest earners, while the former ignores them. In nominal terms, aggregate income grew by 6%, whereas median income grew by 11%. These correspond to declines, in real terms, of about 12% and 8%, respectively.
Another way to see this is that the median is sparse, and so moves faster than the extremes. This would re-enforce that the growth of income was slower in the category of potential homeowners than overall. Of course, the sharper decline in aggregate income could be accounted for many high earners fleeing the city..
3 — As has been pointed out, the vast majority of mortgages are now IO. Moreover, you fail to address the significant increase in household income devoted to mortgage payments. This serves to be able to “buy more house”, and re-enforces my thesis — that expanding debt has been responsible for the price run up.
Here is my calculation, which is consistent with all of the data presented here:
In 2000,
An upper third household making 112K, devoting about 30% of income to mortgage payments with a 30 year FRM at 8.15% would get a 380,000 mortgage.
In 2006,
An upper third household making 10% more (e.g. 124K), devoting 40% of income to mortgage payments with an IO loan at 5.5% would get a 900,000 mortgage.
I think these two examples are much more reflective of the reality of home prices, as well as of borrowers.
robert,
The reported income for both 2000 and 2006 are in 2006 dollars. How can you say the real income declined?
90K in 2006 dollars is about 73K in 2000 dollars.
Please understand what “in 2006 dollars” mean. Your whole post is meaning less.
OK, let me do the calculation:
A family with 75K income, buying a 400K house in 2000. 20% down. 30-year Fixed at 8%. Monthly payment $2348. Mortgage/Income is 37.5% (not counting tax deduction).
A family with 105K income, buying a 700K house in 2006. 20% down. 30-year fixed at 6%. Monthly payment $3357. Mortgage/Income is 38.3% (not counting tax deduction).
Is it smart to spend almost 40% of your gross income on housing? Well….that’s not my point. My point is RE has always been expensive in SF, before and after the bubble.
@John,
Please click on the links and read the headlines. 2000 figures are in inflation adjusted 2000 dollars (i.e. normalizing for the 12 months of inflation that occured in that year). These are the data results of annual surveys, which come out 1-2 years after the fact. They didn’t even know what inflation would be in 2006 when the 2000 survey was published.
The calculation that John did is not perfect, but it does seem to explain the majority away. My issue with it was that the 30 percentile of home owners does not correlate to 30% of top earners. But regardless if it is the top 5% buying the 5% of homes that sold, relative to all housing, (not all 30% ownership occured between 2001 and 2006), the value, be it 15% of 20% still contributes to the 70% the graph indicates. At this point we are splitting hairs as the overall components tend to be support the 70%. Oveerall, good methodology.
Robert,
You are absolutely right. For some reason, I misread the 2000 as 2006.
However, with a little more digging (there are a lot of tables in the census data), I believe it is more appropriate to use “Family income” instead of “Household income”.
Year 2000:
http://factfinder.census.gov/servlet/DTTable?_bm=y&-context=dt&-ds_name=ACS_2000_EST_G00_&-mt_name=ACS_2000_EST_G2000_P100&-CONTEXT=dt&-tree_id=306&-redoLog=true&-geo_id=05000US06075&-search_results=01000US&-format=&-_lang=en&-SubjectID=14815801
Year 2006:
http://factfinder.census.gov/servlet/DTTable?_bm=y&-context=dt&-ds_name=ACS_2006_EST_G00_&-mt_name=ACS_2006_EST_G2000_B19101&-CONTEXT=dt&-tree_id=306&-redoLog=true&-geo_id=05000US06075&-search_results=01000US&-format=&-_lang=en&-SubjectID=14815801
Again, I am trying to find the top 30 percentile:
In 2000, 28.7% families make over $100K. In 2006, 29.2% families make over $125K.
Pretty close to 30 percentile, aren’t they?
So the family income increased a little over 25% over the 6 years, (not inflation adjusted). This is 5% less than my previous estimate, which was 30% for inflation + income increase.
Again, let’s do some loan calculation:
A family with 100K income, buying a 400K house in 2000. 20% down. 30-year Fixed at 8%. Monthly payment $2348. Mortgage/Income is 28.1% (not counting tax deduction).
A family with 105K income, buying a 700K house in 2006. 20% down. 30-year fixed at 6%. Monthly payment $3357. Mortgage/Income is 32.2% (not counting tax deduction).
Yes, the mortgage burden is higher before tax. However, considering that the more you income is, the higher marginal tax rate, I would say the burden is again very close after the tax consideration.
The difference between “household income” and “family income”? I have no idea….I don’t want to dig through all those “survey methodologies” to find out.
This is not a precise calculation. Just want to make some ballpark estimate on the factors contributing to the bubble.
The problem with your calculation John is that you are making a huge assumption that the top 30% of the population buys homes with prudent financing.
Both your 400K and 700K values are below median prices for SF for those years.
If the top 30% bought 400K+ houses and 700K+ houses. then the medians for those years should have been lower.
In fact the 60.1 percent of home loans that closed in Dec 1999 were ARMs. http://archive.dqnews.com/AA2000MOR01.shtm
John – I was actually complementing your analysis and basically agreeing with it. My rhetorical question of “why” was a comment on the bubble mentality that induced buyers to throw every dollar they could at ever-escalating housing prices.
What if families maxed out their budget on automobile and fuel purchases. Say fuel costs dropped from $3.50/gal to $1.50/gal – and say that allowed an average family to spend $200 per month more on the carrying costs of a car. Would then everyone run out and immediately bid up the prices of cars by, say 50% or more, so that the $200 fuel reduction was completely absorbed by increased capital costs on car purchases? I know it’s not a great analogy and the supply/demand curves are different. Your analysis showed how additional money became available to be plowed into housing – but that alone shouldn’t have triggered these bidding wars.
@akrosdabay,
If you want to use median RE price, then you should use the income of top 15 percentile …. that’s the median income of the top 30 percentile, isn’t it?
I use 30 percentile because only 30% of SF residents own (well known fact). So you can safely say that to buy the cheapest property, your income needs to be at the 30 percentile. If you want to buy a median priced property, your income needs to be at top 15 percentile.
And I purposely simply the calculation. There are a lot of other factors – financing options, stock gain, or the fact that it is very common these days for the buyer to get 1% back from realtors as commision rebate, and then, the big factor of tax deduction. Nobody will be satisfied no matter how you do the calculation anyway, so I simplified it, for ballpark estimates.
@FSBO
I think psychologically, the tax deduction is a huge factor. If a family is making 125K, the take-home pay is about $7K/month. Let’s say the family has two adults and two kids. After all the expenses, it probably has $1K left for savings if they are lucky.
What would you do in this situation? You look at the biggest expense (tax bill), and try to figure out a way to reduce that, and then you find out pretty much the only way to reduce that tax bill is through mortgage.
That’s why I bet the 2009 is the bottom. Most likely the dem will win the election, and we will all face a tax increase (either in 2009 or in 2010). You will see open houses crowded from April to June (after people file taxes and get pissed off by the tax burden).
I am not saying I agree with tax increase. I am not saying it is a good strategy to use mortgage to reduce tax. However, IMHO, the impact of our tax code on RE is a matter of fact.
FSBO,
BTW, if you look at my previous calculation, family with 100K income, after $2348/month mortgage, has $71824 (gross) left for the year.
Family with 125K income, after $3357/month mortgage, has $84716 (gross) left for the year.
So, even though higher percentage of gross income go into mortgage in 2006 than in 2000, it is not true that they “throw every dollar” into it.
“What would you do in this situation? You look at the biggest expense (tax bill), and try to figure out a way to reduce that, and then you find out pretty much the only way to reduce that tax bill is through mortgage.”
That is just wrong when you can rent for much cheaper including tax deductions, if one’s only goals was to save money.
@viewlover, john
No, there is an important distinction here.
Housing costs can be explained by 3 factors:
“income”: the income of _homeowners_, not necessarily that of the population. In San Francisco, only about 1/3 are homeowners.
“multiple”: the ratio of homeowner income spent on paying the mortgage.
“financing”: both the interest rate and terms (neg-am, IO, fixed rate)
Let’s look at income data. From census data (not ACS), in the period of 1970-1980, income fell by 29%, from 46K to 33K. From 1980-1990, income grew by 32% to 44K, almost reaching 1970 levels. From 1990-2000, income grew by 25% to 55K, finally exceeding the 1970s levels in nominal terms (still substantially below that in real terms). So, we have nominal income growth of about 2.2% a year from 1990-2000.
From 2000 – 2006, income growth *slowed* to about 1.7% a year, achieving about a 11% increase by 2006. Again, these are nominal amounts. During the same time frame, CPI inflation was substantially higher than income growth, on average, so San Francisco as a city is much poorer now than it was in 1970, or even than it was in 2000. As an entire country, we are *substantially* poorer than we were in 1970, during which time a single middle class wage earner was able to supply a household with health care, housing, retirement savings, vacations, and education. What has happened, in the face of declining income, was that all of the above items began to be financed with personal or government debt that has to continually be re-financed, and this is the explanation of both rising prices in the face of falling wages, as well as potemkin-like denial about the ability of people to pay for these things.
Let’s look at the “multiple”
Here, there is a difference between “expensive” cities, “growing cities”, and “stagnant” cities. In San Francisco, from 1996-2000, the percent of household income devoted to mortgage payments bounced around a narrow range around 25%. In the “growing” cities, this percentage is about 22%, and in the “stagnant” cities, the percentage is around 19%.
So, while it’s true that San Francisco is more expensive, we can measure the multiple difference, and it is 3% from Yakima County, WA. Anyone telling you that paying 40% or even 35% of your income on a mortgage is “the norm” is ignoring the data. The fact is that in more expensive cities, fewer people own and more people rent, but of those wealthier owners, they have historically spent only about 3% more of their income on mortgages than those in Yakima County, WA. The reason for this is simple: spending a higher percentage on mortgage is not sustainable. Wealthier households have correspondingly greater expenses in other parts of their lives, so they cannot afford to spend more than a few percentage points on housing than their Yakima County counterparts.
Now, there is a “career arc” dynamic, in which young households with junior positions pay an above average multiple (say 30%), and as they climb the career ladder, the multiple shrinks (say to 20%), but the average multiple according to 10 years of census data is 25%.
Now, this multiple expands and contracts by a few percentage points during boom and bust times, just like multiple expansion for stocks. 2000 was actually a *peak*, after an almost doubling of home prices since 1997, and prices began to decline in 2001, until the Neg AM, NINJA, IO crowd entered the scenes. In the 2000 peak, the multiple for San Francisco reached 26.5%.
http://factfinder.census.gov/servlet/DTTable?_bm=y&-context=dt&-ds_name=ACS_2000_EST_G00_&-CONTEXT=dt&&-mt_name=ACS_2000_EST_G2000_H089&-tree_id=306&-redoLog=false&-_caller=geoselect&-geo_id=A4000US003&-geo_id=A4000US023&-geo_id=A4000US025&-geo_id=A4000US028&-search_results=01000US&-format=&-_lang=en&-SubjectID=14816220
But, rather than the multiple declining back down to 24% from 26%, the trend reversed itself, and the multiple expanded further, reaching 30% by 2006:
http://factfinder.census.gov/servlet/DTTable?_bm=y&-context=dt&-ds_name=ACS_2006_EST_G00_&-CONTEXT=dt&-mt_name=ACS_2006_EST_G2000_B25092&-tree_id=306&-redoLog=false&-geo_id=05000US06075&-search_results=01000US&-format=&-_lang=en&-SubjectID=14830908
This had never happened before, and for good reason. It’s simply not sustainable to devote such a large percentage of income to mortgage payments. This is why you see the default rates climbing, houses being put back on the market after only a few years, etc.
Now, multiple expansion and contraction, just like in stocks, is related to the perception of risk. When everyone believes prices will increase, they are willing to devote more of their income. Prices continue to increase until so much income is cannibalized that defaults began to soar, at which point risk is re-priced. The repricing typically *undershoots* as people over-estimate risks.
Now, the financing story is well known. From 30 yr f.r.m at 8% to IO loans at 5.5%. At this point, the SF market is almost entirely IO loans (over 70% in 2005 and the number for 2006 will be higher). Why John is using a 30 year f.r.m., and an income growth assumption of 40% in his example is beyond me.
So, the crux of this argument is whether the house price run-up was due to a massive 40% increase in wages + cheap financing, with stagnant multiples, or whether the increase was due to stagnant wages, cheap financing, and massive multiple expansion. There is substantial data that the latter is the case.
This is crucial to understand the extent of the price declines. Interest rates will normalize as banks reprice repayment risk, and multiple rates will also stabilize as borrowers reprice appreciation risk. There is no need to rely on income declines to cause a mean reversion of *all* *gains* in prices, as income gains were responsible only for a small sliver (less than inflation) of the house price gains.
@ John,
It is a well known fact that only approx 30% of SF households [owned] in the earlier part of this decade. However, according to the census stats it appears that this has grown to 40% in 2006.
That’s a pretty big increase in demand. I think that new mortgage products, reduced lending standards (perhaps fraud in some cases), and the desire not to be “priced-out” contributed to this.
From looking at the data it appears that the spike upward occured in 2004.
If 25% of the curent number of owning households would not traditionally have been SF buyers under the old mortgage underwriting system then I would think they might struggle to remain owners if rates increase for them.
Maybe I’m tkaing things too far, but if only half of these people return to the rental pool wouldn’t that put a lot of properties (approx 16,000) onto the market?
The busiest year for SF real estate since 1987 was 2004 when 6,496 properties changed hands (according to the MLS).
You need to examine lifetime housing costs for ownership vs. rent.
NVJ, I think you are confused by the fact that mortgages are for 30 years and you are ignoring downpayments.
I am trying to compare the relative cost of an asset that is purchased as one time with the relative cost of an asset that is consumed as a perpetual stream of rental payments.
In order to make this comparison, you must amortize the asset. That is how you calculate the owner’s burden and compare it to the renter’s. Now, to make a true comparison, you would amortize with a zero downpayment and a repayment time stretched to infinity (i.e. a perpetual interest only loan). In such a world, there would be no such thing as “paid off” houses.
Of course, I don’t have that data. Some houses are paid off, and those that aren’t are fixed term payments with downpayments. The clever thing is to notice that downpayment distortions effectively offset the fixed term distortions.
I.e., a 5.3% perpetual IO loan has the same monthly payment as a 5.3% thirty-year amortizing loan with a downpayment of 20% of the principle. A 6% perpetual IO loan has the same payment as a thirty-year amortizing loan with a downpayment of 16% of the principle. This is no accident. So these two effects to tend cancel each other out quite effectively for “reasonable” terms. Therefore, I infer that actual amortizing houses have an ownership costs that can be compared to perpetual rental streams. I cannot infer that non-amortizing houses have an owner cost that can be compared to perpetual rental payments. I cannot even compare non-amortizing assets to perpetual term payments, because the comparison requires amortization. Consider the following:
If the rental cost was the same as the mortgage payments, and if both the renter and the owner set aside 20% of the value of the house — with the owner paying 5.25% interest for thirty years, and the renter earning 5.25% interest in perpetuity, then after 30 years, the owner would have “paid off” the house, and the renter would have accumulated a sufficiently large amount of money so that the interest on it would fully fund all future rental payments — i.e. both would live for free. Amortized houses simply drop out of the universe for comparison.
Another option is to impute an amortization payment to assets which are not being amortized. I claim this would distort the data. This is because for paid off owners, many of them would not be able to afford their house in the current environment, and so the owner costs as a percentage of their income would balloon and distort the income burden ratio. I assume that those houses are basically “off the market”. If they were to really sell the house, they would do so to another household, and that household’s income would be used in the cost ratio. Because I don’t know the income of the future buyer, it is better to drop the house rather than make up a household income and owner burden for it. Moreover, this is more accurate for another reason — the data has time lags in it, and measuring more recent transactions is more accurate.
Back to my point, I am trying to measure the burden of amortizing the asset vs. the burden of renting it. It does not matter if SFH homes “cost more”, since those households will have higher incomes. The ratio allows one to drop issues of mix or quality. The one key assumption is that the median household will consume as much house as they can afford, with appropriate adjustments for the owner premium/discount. Now, LMRIM said that the option value should fall off for the highest property classes, but this is not so important, since the ratio is a median. Here, then, is the data:
Year Owner Renter Spread = tracks option value
1990 25% 28% +3%
1997 24% 27% +3%
2000 26% 28% +2%
2001 26% 25% +1%
2002 27% 26% -1%
2003 29% 27% -2%
2004 30% 28% -2%
2005 31% 28% -3%
2006 30% 27% -3%
2007 31% 27% -4%
Now, I claim that the true “median equity discount” should be about 3%. That is how much more of your income you are required to pay if you are renting. The current negative spread should revert to this level, and according to this trend, homes started to become over-valued in the late 1990s, which corresponds to the actual price run-up. Now, perhaps we are entering a new era of the renter discount (which would be fine by me!) — we’ll see what the future brings.
A sound analysis but I suspect the real question is:
Do you bet that there won’t be a currency event that will wipe out your savings/return?
Or do you bet that there won’t be a seismic event that will wipe out your real asset?
You responded to a different thread, but I see why. The background for your analysis is here.
I think you should look at the ACS data again. I am looking at the 2000 data and I see that owners are paying 26.5% but that renters are paying 24.5%, for a -2% spread.
I haven’t looked at all of them, and probably won’t go back and decipher the older data, but perhaps you misread the 2000 data.
You are using the series
H089. MEDIAN SELECTED MONTHLY OWNER COSTS AS A PERCENTAGE OF HOUSEHOLD INCOME IN THE PAST 12 MONTHS – Universe: SPECIFIED OWNER-OCCUPIED HOUSING UNITS
and
H068. MEDIAN GROSS RENT AS A PERCENTAGE OF HOUSEHOLD INCOME IN THE PAST 12 MONTHS (DOLLARS) – Universe: SPECIFIED RENTER-OCCUPIED HOUSING UNITS PAYING CASH RENT
correct?
Try this link http://tinyurl.com/crwq6u
I see your argument about including down payments and I had not known that a perpetual amortizing i/o loan payment equals one with a 30 year term and a 20% down payment, that is kind of interesting. We are saying the same thing here in different ways. I said you should take the mortgage payments and deduct the amount applied to principal. Why do you say that it is no accident?
You analysis about setting aside the 20% of the down payment for the renter is interesting, but again, whether the 5.25% gain on their savings would be enough to actually pay the rent in 30 years depends on how much rent inflation was in that interval.
5.25% for 30 years pretty much quintuples your savings (do the math, or perhaps you already did and picked these numbers on purpose) so in an environment with no asset inflation whatsoever, you would be able to buy the property outright. But there is asset inflation, or at least has been in the past.
I am still chewing on your statement that paid off homes should drop out of the discussion. It is probably true that it used to be easier to pay off a home in SF than it is today, so throwing them in there understates the amount of the present run-up.
NVJ,
The Editor moved my comment here — which is fine.
I think you should look at the ACS data again…
For the numbers, you are right — I made an error in the data (be careful with the web interface, since some search fields end up being cached). Here is an updated table. Note that “ACS 2000” data is for the year 2000, and it comes out over 1 year later, whereas “Census 2000” data is really for 1999. Also, for 2007, I used the 1 year, not the 3 year estimate. The census ftp site is on the fritz, so I can’t get any 1996-1998 data at the moment. Here is an updated table, with links:
Year Owner Renter Spread
1989 24.6% 28.0% +3.4%
1999 25.2% 24.6% -0.6%
2000 26.5% 24.5% -1.0%
2001 26.1% 25.1% -1.0%
2002 27.2% 25.6% -1.6%
2003 29.2% 27.1% -2.1%
29.6% 27.9% -1.7%
2005 30.6% 28.2% -2.4%
2006 20.4% 27.1% -3.3%
2007 31.1% 26.9% -4.2%
As to the IO/Amortizing comparison, it’s just a little algebra applied to the annuity equation. Any perpetual IO mortgage for principal P, at a given interest rate, r, can be equivalent to an amortizing mortgage for principal P-D, with the same rate and payment, provided that a large enough downpayment, D, is made. D is the net present value of a one time principal payment, P, made at the end of the loan term, discounted by the mortgage rate, r.
In other words, you take out an IO-loan for P, but at the same time use the downpayment to buy a mortgage bond yielding rate r, then after 30 years of compounding, your downpayment would be equal to the principal, so you pay off the loan and stop paying interest.
That is exactly the same as giving the downpayment to the bank up-front and taking out an amortized loan for P-D — your monthly payments would be the same.
Alternately, a renter could use the downpayment to buy a mortgage bond with rate r, and re-invest the interest for 30 years, after which he could the interest would perpetually pay his rent (assumed to be rP).
The main point underlying these scenarios is that you can always convert a stream of fixed payments into a single payment, or into a stream of perpetual payments, and back again. You can even make the payments variable — the math is not complicated — but most people don’t think in these terms, so they try to compare a non-amortizing asset with an amortizing one. This is why I was objecting to NVJ trying to compare the owner burden for paid off mortgages (basically utilities, taxes, and maintenance) with the perpetual renter burden. You have to first convert the paid off asset into perpetual payments, or discount the perpetual rental payments into a lump sum payment, and compare apples to apples. Since the census data in question only contains monthly payment snapshots, I prefer to treat these as perpetual purchase payments and compare them to renter burdens. I also think you can safely drop this paid off population, since they are not characteristic of the current rent/buy trade-offs.
Of course, in the real world, no purchaser would be able to get a perpetual or even a 30 year IO-loan, just as no renter would be able to have fixed eternal payments — for the same reason. Both would be forced to periodically change their payments to adjust for changes in the prevailing rate, which would depend on inflation and income growth rates, the renter would adjust every year (potentially) and the owner for the term of the loan (e.g. every 5-10 years, or annually for an ARM). In exchange for the fixed payments, the owner would pay a premium — this is the “spread game” that LMRIM referred to before. Whether or not the premium is justified depends on whether you can outsmart the investors that buy mortgage bonds — since of course they are assuming that they will be ahead vis-a-vis inflation and their own required rate of return.
P.S. Sorry for the html formatting error (the unlabeled year is 2004), and the garbled prose.