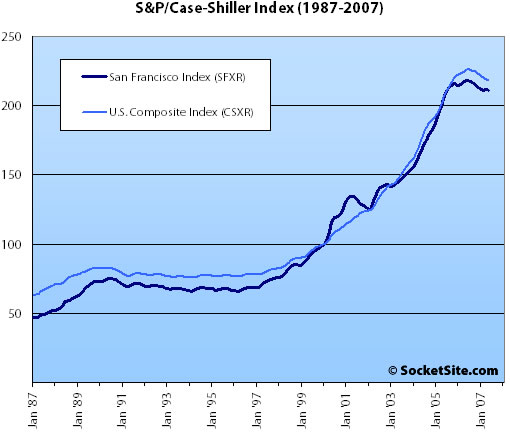
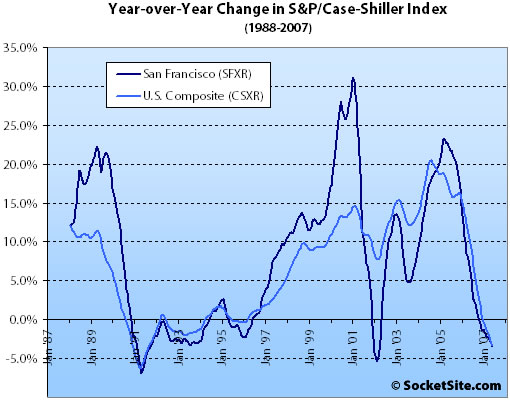
According to the May 2007 S&P/Case-Shiller index (pdf), single-family home prices in the San Francisco MSA slipped 3.4% year-over-year and fell 0.3% from April ’07 to May ’07. For the broader 10-City composite (CSXR), year-over-year price growth is down 3.4% (down 0.3% from April).
The (now) standard SocketSite footnote: The S&P/Case-Shiller index only tracks single-family homes (not condominiums which represent half the transactions in San Francisco), is imperfect in factoring out changes in property values due to improvements versus actual market appreciation (although they try their best), and includes San Francisco, San Mateo, Marin, Contra Costa, and Alameda in the “San Francisco” index (i.e., the greater MSA).
∙ Late Spring Numbers Bring Chilly Returns (pdf) [Standard & Poor’s]
It’s too bad that the data isn’t available county by county, though perhaps the numbers wouldn’t be great enough in SF alone for statistical significance.
The number of single family homes sold in SF is overwhelmed by the number of homes sold in the East Bay, so the clear downturn in the outer suburbs obscures the market in SF.
Is there any county-by-county data available that highlights just the city of San Francisco? It would be nice to see this without all the ‘white noise’ from the surrounding counties/cities.
It’s too bad that Case-Shiller doesn’t seem to be too useful for info on SF prices; I wonder why they don’t have an apartment price index?
However, for the Bay Area as a whole, it’s divergence from the median does seem to add evidence that the “mix” is what is causing the Bay Area median to continue to climb.
To my knowledge, Shiller’s index does not report individual city/counties… for SF it only counts the San Francisco MSA. (which includes other cities in the Bay area)
http://www2.standardandpoors.com/spf/pdf/index/SPCS_MetroArea_HomePrices_Methodology.pdf
—
There are other home price indices you can use, most commonly is OFHEO’s data which does look at San Francisco-proper. the problem with OFHEO is that it ONLY includes “conforming” mortgages with Fannie and Freddie, and I’d guess that most San Francisco mortgages are not conforming mortgages. (so OFHEO misses the majority of home purchases in San Francisco proper due to price)
http://www.ofheo.gov/download.asp
[Editor’s Note: OFHEO First Quarter Report: 0.35% Appreciation For SF MSAD]
You can also get some city and county stats by dataquick (this is the data the NAR uses… it’s constructed in a different way than OFHEO and Case-Shiller’s index)
http://www.dqnews.com/
[Editor’s Note: San Francisco: Sales Metrics Moving In Different Directions (Again)]
—
***There are important methodological differences between the NAR data, the OFHEO data, and Shiller’s data. Each has their pros and each has their cons. Here’s a synopsis of the differences
http://www.cme.com/files/housing_faq.pdf
Hi, anybody knows how to find the data number of houses sold that OFHEO and Case Shiller used to calculate the HPI?
I need to find the historical data for each MSAs that they included.
thanks