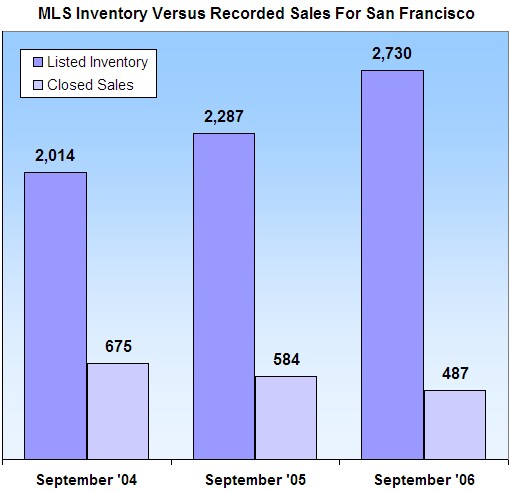
Some interesting September-to-September data points courtesy of the SFHomeBlog:
∙ MLS listed inventory in San Francisco is up 36% from 9/04
∙ MLS recorded sales in San Francisco are down 28% from 9/04
We can’t vouch for the data, but if you take it at face value, listed housing supply in San Francisco has increased from 3.0 months in September 2004 to 5.6 months in September 2006. And if you’re an advocate for simple “supply and demand” economics for housing, any thoughts on what one should infer regarding prices?
Just for the record, we’ve never used the words “crash,” “tanking,” or “bleak.” We are, however, quite fond of the words “trend,” “changing,” and “informed.” (And yes, sometimes even “troubling.”)
∙ Basic Supply & Demand (San Francisco) – pdf [SFHomeBlog]
Matt sure is concerned with how his posts are interpreted. And he seems to like you Cii concept too. Don’t understand why he is so affraid of the words correction or adjustment, but rather chooses to explain the concept of supply and dempand, along with its pricing impacts. I admire his consistency!
The forces of supply and demand no longer apply. It’s a new paradigm…
Given all the concern about inventory, it is interesting to see what the year-to-year numbers are for condos (not including TICs) and single-family homes. For the first nine months through Sept. 30th, the average condo price declined a slim 0.1% from $842,889 to $841,569. The average single-family home increased 3.2% from $1,097,663 to $1,132,991. Yes volume is down and inventory is up, but average prices paid convey an interesting message…mk
And what is the message? Averages can be misleading. What we need to look at is the mix/product of homes out in the market. You say that average prices are up…. let’s take a look at the homes sold in the last nine months. Are there a large number of homes sold on the high end? If the answer is yes, of course these will drive the averages up.
From what I have read, a four to six month supply of homes is considered a balanced market. There has typically been a lower supply of available homes (closer to one to three months) in the area over the past decade which plays a significant role in people’s perception of a hot market. This is a key figure in the health of a market that is also fairly hard to get a firm grip on in SF. If you start adding the hidden availabilities in the SOMA new construction projects then you also have to add in the sales from these projects too. Regardless, it merits more attention and may even signal a “troubling” market if the supply gets up to the 9-12 month (or more) mark.
Aren’t we also slightly mismatching statistics? The listed inventory number is September, while average/median price numbers are usually on a 2-3 month delay depending on the service. I don’t think September medians have come out yet.
Also worth noting from past downturns and downturns that are currently happening in other locations, price declines tend to trail inventory increases/sales declines by quite a time. So the fact that average prices are essentially even right now, probably isn’t too useful an indicator or what’s likely to happen over the next couple of years.
Plus, as has been pointed out, averages/medians can be misleading anyway. Price per sq ft is probably better, but, again, in a downturn it tends to be the “better” properties that actually sell.
I anticipate 2007 will bring the long-dreaded price correction. Afterall, in 2004, 45.3% of all SF loans were interest-only. A lot of those folks are in over their heads. With the IRS now willing and able to provide quick electronic confirmation of incomes, the feds tightening the qualification rules, and lenders getting anxious, many of those folks are going to have a hard time refinancing, much less affording the adjusted mortgage payments (how about a another roommate or two?) Given that the bond market is headed south, mortgage rates are headed up again, the broader US residential real-estate market (particularly feeder markets for SF like Boston and Washington DC) are in significant correction, and the downward pressure on prices throughout the broader Bay Area (particularly out east and up north), I anticipate some downward drift in SF.
Let’s just say hypothetically, that in 2005, homes are sold with no inspection contingency and no rebate for closing costs. A home that sells for $1M is all paid to the seller.
Lets say in 2006, that inspection contingencies and closing cost rebates cause the sellers to have to rebate an average of 5% of the sale price to the buyer for both repairs and any closing costs. That is, if the home lists for $1M, but the seller takes $950K. Lets say that the sellers don’t fully lower the price by the rebates: they sell the same place for 1.03M, but rebate $50K.
What happens to the “reported median”? It goes up, from 1M to 1.03M. “HOUSING PRICES RISE BY 3%” scream the headlines.
What really happened to prices? They went down. The seller got less cash. Can you tell what is happening to prices by looking at medians or even sale prices? Nope.
Are there any better metrics to use?
You guys do realize ‘CLOSED SALES’ does not = DEMAND right?
You’re comparing Supply vs. closed sales, wherease you should compare SUPPLY to DEMAND. I’m surprised nobody understand or noticed this comparison? Are most people on here renters?
If you graphed DEMAND, you’d clearly see the bar chart fly through the roof and darf supply.
Silly guys.
Let’s assume that DEMAND has been constant for the past year. Haven’t we already seen SUPPLY increasing in the last year as well? Yes… simple supply/demand CURVE will show that prices should theoretically come DOWN.
Anon at 5:06PM – Brilliant. You do realize that it’s the Realtor’s report that’s titled “Supply & Demand” right? (Must be a renting Realtor…) And if “demand” was greater than supply, inventory would be dropping.
Regarding Malcolms comment on price appreciation in SF, I think the average price on sold homes are up because a nice property in SF will still sell for a premium. One of my friends lives in West Portal and he told me that he can still put his home for sale and have it sold within weeks (of course as long as it’s competitively priced). A few of his neighbors apparently sold their home quickly.
My guess is the increase in inventory relates to a lot of extra overpriced cookie cutters out there in the market (King St. Lansing, etc). These properties are the equivalent of Webvan back in the dotcom bust (OK, maybe not that dramatic). Additionally, a bad home on the market will not sell at all in this market. Why would anyone want to waste their time on a problem unit when there is over 5 months of homes on the market.
Agree re: nice properties, but I just did a quick search and it looks like only 10% of the current inventory is in SOMA/Mission Bay (those “cookie cutter” buildings).
And while I agree that there are a lot of “bad” homes on the market, keep in mind that one to two years ago bad homes didn’t have any trouble selling. [Removed by Editor]
There is a lot of demand for housing in SF. The problem lies in price expectations. We’re not talking about widgets, we’re talking about homes. As prices decline slightly in SF, there is a whole new crop of buyers that are willing to jump in the market since they can now afford what they thought they couldn’t only a few months ago. As a result, I believe price declines will occur very slowly in the SF market. But that doesn’t mean that we’re not at the begining of a 5 year slow decline that could reach 5-15%.